Thrifty Car Rental 2009 Annual Report Download - page 32
Download and view the complete annual report
Please find page 32 of the 2009 Thrifty Car Rental annual report below. You can navigate through the pages in the report by either clicking on the pages listed below, or by using the keyword search tool below to find specific information within the annual report.-
 1
1 -
2
-
3
-
4
-
5
-
6
-
7
-
8
-
9
-
10
-
11
-
12
-
13
-
14
-
15
-
16
-
17
-
18
-
19
-
20
-
21
-
 22
22 -
 23
23 -
 24
24 -
 25
25 -
 26
26 -
 27
27 -
 28
28 -
 29
29 -
 30
30 -
 31
31 -
 32
32 -
 33
33 -
 34
34 -
 35
35 -
 36
36 -
 37
37 -
 38
38 -
 39
39 -
 40
40 -
 41
41 -
 42
42 -
43
-
44
-
45
-
46
-
47
-
48
-
49
-
50
-
51
-
52
-
53
-
54
-
55
-
56
-
57
-
58
-
59
-
60
-
61
-
62
-
63
-
64
-
65
-
66
-
67
-
68
-
69
-
70
-
71
-
72
-
73
-
74
-
75
-
76
-
77
-
78
-
79
-
80
-
81
-
82
-
83
-
84
-
85
-
86
-
87
-
88
-
89
-
90
-
91
-
92
-
93
-
94
-
95
-
96
-
97
-
98
-
99
-
100
-
101
-
102
-
103
-
104
-
105
-
106
-
107
-
108
-
109
-
110
-
111
 |
 |

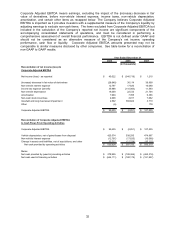
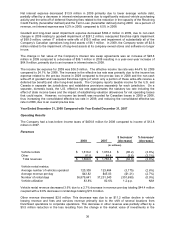
Use of Non-GAAP Measures For Measuring Results
Non-GAAP pretax income (loss), non-GAAP net income (loss) and non-GAAP EPS exclude the impact of
the (increase) decrease in fair value of derivatives and the impact of goodwill and long-lived asset
impairments, net of related tax impact (as applicable), from the reported GAAP measure. Due to volatility
resulting from the mark-to-market treatment of the derivatives and the nature of the non-cash
impairments, which are both non-operating items, the Company believes non-GAAP measures provide an
important assessment of year over year operating results. See table below for a reconciliation of non-
GAAP to GAAP results.
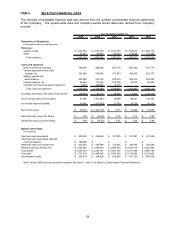
Reconciliation of reported GAAP pretax income (loss) per the
income statement to non-GAAP pretax income (loss):
2009 2008 2007
(in thousands)
Income (loss) before income taxes - as reported 81,008$ (456,801)$ 12,808$
(Increase) decrease in fair value of derivatives (28,848) 36,114 38,990
Goodwill and long-lived asset impairment 2,592 366,822 3,719
Pretax income (loss) - non-GAAP 54,752$ (53,865)$ 55,517$
Reconciliation of reported GAAP net income (loss) per the
income statement to non-GAAP net income (loss):
Net income (loss) - as reported 45,022$ (346,718)$ 1,215$
(Increase) decrease in fair value of derivatives, net of tax (a) (16,917) 21,271 22,813
Goodwill and long-lived asset impairment, net of tax (b) 1,497 284,537 2,236
Net income (loss) - non-GAAP 29,602$ (40,910)$ 26,264$
Reconciliation of reported GAAP diluted earnings (loss)
per share ("EPS") to non-GAAP diluted EPS:
EPS, diluted - as reported 1.88$ (16.22)$ 0.05$
EPS impact of (increase) decrease in fair value of derivatives, net of tax (0.71) 1.00 0.97
EPS impact of goodwill and long-lived asset impairment, net of tax 0.06 13.31 0.09
EPS, diluted - non-GAAP (c) 1.24$ (1.91)$ 1.11$
(a) The tax effect of the (increase) decrease in fair value of derivatives is calculated using the entity-specific, U.S. federal
and blended state tax rate applicable to the derivative instruments which amounts are ($11,931,000), $14,843,000
and $16,177,000 for the years ended December 31, 2009, 2008 and 2007, respectively.
(b) The tax effect of the goodwill and long-lived asset impairment is calculated using the tax-deductible portion of
the impairment and applying the entity-specific, U.S. federal and blended state tax rate which amounts are
$1,095,000, $82,285,000 and $1,483,000 for the years ended December 31, 2009, 2008 and 2007, respectively.
(c) Since each category of earnings per share is computed independently for each period, total per share amounts may
not equal the sum of the respective categories.
Year Ended December 31,
31