Thrifty Car Rental 2009 Annual Report Download - page 39
Download and view the complete annual report
Please find page 39 of the 2009 Thrifty Car Rental annual report below. You can navigate through the pages in the report by either clicking on the pages listed below, or by using the keyword search tool below to find specific information within the annual report.-
 1
1 -
2
-
3
-
4
-
5
-
6
-
7
-
8
-
9
-
10
-
11
-
12
-
13
-
14
-
15
-
16
-
17
-
18
-
19
-
20
-
21
-
22
-
23
-
24
-
25
-
26
-
27
-
28
-
 29
29 -
 30
30 -
 31
31 -
 32
32 -
 33
33 -
 34
34 -
 35
35 -
 36
36 -
 37
37 -
 38
38 -
 39
39 -
 40
40 -
 41
41 -
 42
42 -
 43
43 -
 44
44 -
 45
45 -
 46
46 -
 47
47 -
 48
48 -
 49
49 -
50
-
51
-
52
-
53
-
54
-
55
-
56
-
57
-
58
-
59
-
60
-
61
-
62
-
63
-
64
-
65
-
66
-
67
-
68
-
69
-
70
-
71
-
72
-
73
-
74
-
75
-
76
-
77
-
78
-
79
-
80
-
81
-
82
-
83
-
84
-
85
-
86
-
87
-
88
-
89
-
90
-
91
-
92
-
93
-
94
-
95
-
96
-
97
-
98
-
99
-
100
-
101
-
102
-
103
-
104
-
105
-
106
-
107
-
108
-
109
-
110
-
111
 |
 |
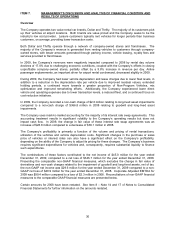
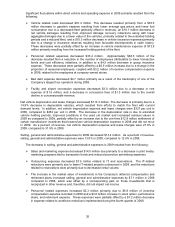
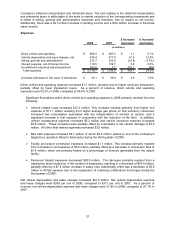
The increase in net vehicle depreciation and lease charges in 2008 resulted from the following:
¾Vehicle depreciation expense increased $45.3 million, resulting primarily from a 12.9% increase
in the average depreciation rate due to vehicle manufacturer price increases on Program
Vehicles and lower residual values on Non-Program Vehicles due to a soft used car market.
These increases were partially offset by a higher mix of Non-Program Vehicles, which typically
have lower depreciation rates, and resolving outstanding incentive negotiations relating to prior
model years with the Company’s primary vehicle supplier, which resulted in increased incentive
income recognition.
¾Net vehicle gains on the disposal of Non-Program Vehicles, which reduce vehicle depreciation
and lease charges, decreased $17.9 million. This decrease resulted primarily from significantly
fewer units sold in 2008, as a result of the longer hold periods, and a lower average gain per unit
due to softness in the used car market.
¾Leasing charges, for vehicles leased from third-parties, decreased $1.7 million due to a decrease
in the average number of vehicles leased.
Selling, general and administrative expenses for 2008 decreased $16.8 million. As a percent of revenue,
selling, general and administrative expenses were 12.6% in 2008, compared to 13.1% in 2007.
The decrease in selling, general and administrative expenses in 2008 resulted from the following:
¾Personnel related expenses decreased $7.9 million primarily due to a $4.7 million decrease in
performance share expense related to declining results compared to performance targets for
2008 compared to 2007, a $1.8 million decrease in retirement expense and a $1.4 million
decrease in 401(k) expense due to the suspension of matching contributions during the first
quarter of 2008. These decreases were partially offset by a $1.0 million increase in stock options
expense.
¾Transition costs relating to the outsourcing of IT and call center operations decreased $4.6
million, including salary related expenses.
¾Sales and marketing expense decreased $3.2 million due primarily to decreased Internet-related
spending and other marketing related costs.
¾Software expenses decreased $2.8 million primarily due to a decrease in outsourcing expenses.
¾Separation costs, primarily related to the elimination of certain positions from the organizational
structure, were lower by $1.0 million.
¾The change in the market value of investments in the Company’s deferred compensation and
retirement plans increased selling, general and administrative expenses $5.5 million due to a
reduction in the loss on these plans in 2008 compared to 2007, which is offset in other revenue
and, therefore, did not impact net income.
Net interest expense increased $0.8 million in 2008 primarily due to a decrease in interest
reimbursements relating to vehicle programs and lower earnings on invested funds resulting from lower
interest rates, partially offset by lower average vehicle debt. As a percent of revenue, net interest
expense was 6.5% in 2008, compared to 6.3% in 2007.
Goodwill and long-lived asset impairment expense increased $363.1 million in 2008, due to non-cash
charges in 2008 relating to goodwill impairment of $281.2 million, reacquired franchise rights impairment
of $69.0 million, certain IT initiative write-offs of $10.5 million and impairment of substantially all of the
Company’s Canadian operations long-lived assets of $6.1 million. In 2007, the Company wrote off certain
fleet related software totaling $3.7 million made obsolete by the Pros Fleet Management Software the
Company began implementing during the third quarter of 2007.
The change in fair value of the Company’s interest rate swap agreements was a decrease of $36.1 million
in 2008 compared to a decrease of $39.0 million in 2007 resulting in a year-over-year increase of $2.9
million.
38