Thrifty Car Rental 2009 Annual Report Download - page 36
Download and view the complete annual report
Please find page 36 of the 2009 Thrifty Car Rental annual report below. You can navigate through the pages in the report by either clicking on the pages listed below, or by using the keyword search tool below to find specific information within the annual report.-
 1
1 -
2
-
3
-
4
-
5
-
6
-
7
-
8
-
9
-
10
-
11
-
12
-
13
-
14
-
15
-
16
-
17
-
18
-
19
-
20
-
21
-
22
-
23
-
24
-
25
-
 26
26 -
 27
27 -
 28
28 -
 29
29 -
 30
30 -
 31
31 -
 32
32 -
 33
33 -
 34
34 -
 35
35 -
 36
36 -
 37
37 -
 38
38 -
 39
39 -
 40
40 -
 41
41 -
 42
42 -
 43
43 -
 44
44 -
 45
45 -
 46
46 -
47
-
48
-
49
-
50
-
51
-
52
-
53
-
54
-
55
-
56
-
57
-
58
-
59
-
60
-
61
-
62
-
63
-
64
-
65
-
66
-
67
-
68
-
69
-
70
-
71
-
72
-
73
-
74
-
75
-
76
-
77
-
78
-
79
-
80
-
81
-
82
-
83
-
84
-
85
-
86
-
87
-
88
-
89
-
90
-
91
-
92
-
93
-
94
-
95
-
96
-
97
-
98
-
99
-
100
-
101
-
102
-
103
-
104
-
105
-
106
-
107
-
108
-
109
-
110
-
111
 |
 |
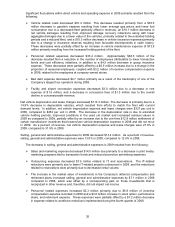
Significant fluctuations within direct vehicle and operating expense in 2009 primarily resulted from the
following:
¾Vehicle related costs decreased $61.4 million. This decrease resulted primarily from a $35.6
million decrease in gasoline expense resulting from lower average gas prices and lower fuel
consumption due to a decreased fleet (primarily offset in revenue), an $18.1 million decrease in
net vehicle damages resulting from improved damage recovery collections along with lower
aggregate damages due to a lower value of the vehicles, primarily related to the extended holding
periods and a reduced fleet, and a $10.3 million decrease in vehicle insurance expenses primarily
due to a change in insurance reserves resulting from favorable developments in claim history.
These decreases were partially offset by an increase in vehicle maintenance expense of $13.8
million primarily resulting from the increased holding period of the fleet.
¾ Personnel related expenses decreased $33.4 million. Approximately $38.5 million of the
decrease resulted from a reduction in the number of employees attributable to lower transaction
levels and cost efficiency initiatives, in addition to a $4.5 million decrease in group insurance
expense. These decreases were partially offset by a $6.5 million increase due to a change in the
proportion of seasonal employees, coupled with $3.2 million of incentive compensation expense
in 2009, related to the employees at company-owned stores.
¾ Bad debt expense decreased $4.7 million primarily as a result of the bankruptcy of one of the
Company’s largest tour operators during 2008.
¾Facility and airport concession expenses decreased $3.0 million due to a decrease in rent
expense of $1.6 million, and a decrease in concession fees of $1.3 million due to the overall
decline in concessionable revenue.
Net vehicle depreciation and lease charges decreased $113.3 million. The decrease is primarily due to a
14.9% decrease in depreciable vehicles, which resulted from efforts to match the fleet with current
demand levels. In addition, net vehicle depreciation expense and lease charges were $337 per unit in
2009, compared to $363 per unit in 2008. The decrease in the depreciation rate is due to extended
vehicle holding periods, improved conditions in the used car market and increased residual values in
2009 as compared to 2008, partially offset by an increase due to the one-time $12.9 million settlement of
certain manufacturer incentives that lowered per vehicle depreciation expense in 2008 and did not recur
in 2009. As a percent of revenue, net vehicle depreciation expense and lease charges were 27.6% in
2009, compared to 31.8% in 2008.
Selling, general and administrative expenses for 2009 decreased $13.4 million. As a percent of revenue,
selling, general and administrative expenses were 13.0% in 2009, compared to 12.6% in 2008.
The decrease in selling, general and administrative expenses in 2009 resulted from the following:
¾ Sales and marketing expense decreased $14.5 million due primarily to a decrease in print media,
marketing programs tied to transaction levels and reduced promotion advertising expenses.
¾Outsourcing expenses decreased $7.6 million related to IT and reservations. The IT-related
reductions were primarily due to fewer IT-related projects outsourced in 2009, and the reductions
related to reservations were primarily due to decreased rental volume.
¾ The increase in the market value of investments in the Company’s deferred compensation and
retirement plans increased selling, general and administrative expenses by $7.1 million in 2009
compared to 2008, which was offset by a corresponding gain on those investments that is
recognized in other revenue and, therefore, did not impact net income.
¾ Personnel related expenses increased $2.3 million primarily due to $6.8 million of incentive
compensation expense recorded in 2009 and a $3.0 million increase in stock option, performance
share, and retirement expense. These expenses were partially offset by a $7.2 million decrease
in expense related to workforce reductions implemented during the fourth quarter of 2008.
35