Thrifty Car Rental 2009 Annual Report Download - page 71
Download and view the complete annual report
Please find page 71 of the 2009 Thrifty Car Rental annual report below. You can navigate through the pages in the report by either clicking on the pages listed below, or by using the keyword search tool below to find specific information within the annual report.-
 1
1 -
2
-
3
-
4
-
5
-
6
-
7
-
8
-
9
-
10
-
11
-
12
-
13
-
14
-
15
-
16
-
17
-
18
-
19
-
20
-
21
-
22
-
23
-
24
-
25
-
26
-
27
-
28
-
29
-
30
-
31
-
32
-
33
-
34
-
35
-
36
-
37
-
38
-
39
-
40
-
41
-
42
-
43
-
44
-
45
-
46
-
47
-
48
-
49
-
50
-
51
-
52
-
53
-
54
-
55
-
56
-
57
-
58
-
59
-
60
-
 61
61 -
 62
62 -
 63
63 -
 64
64 -
 65
65 -
 66
66 -
 67
67 -
 68
68 -
 69
69 -
 70
70 -
 71
71 -
 72
72 -
 73
73 -
 74
74 -
 75
75 -
 76
76 -
 77
77 -
 78
78 -
 79
79 -
 80
80 -
 81
81 -
82
-
83
-
84
-
85
-
86
-
87
-
88
-
89
-
90
-
91
-
92
-
93
-
94
-
95
-
96
-
97
-
98
-
99
-
100
-
101
-
102
-
103
-
104
-
105
-
106
-
107
-
108
-
109
-
110
-
111
 |
 |

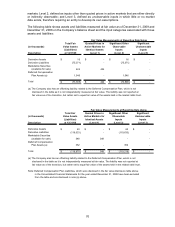
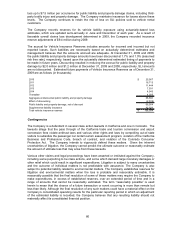
markets; Level 2, defined as inputs other than quoted prices in active markets that are either directly
or indirectly observable; and Level 3, defined as unobservable inputs in which little or no market
data exists, therefore requiring an entity to develop its own assumptions.
The following table shows assets and liabilities measured at fair value as of December 31, 2009 and
December 31, 2008 on the Company’s balance sheet and the input categories associated with those
assets and liabilities:
Total Fair Quoted Prices in Significant Other Significant
(in thousands) Value Assets Active Markets for Observable Unobservable
(Liabilities) Identical Assets Inputs Inputs
Description at 12/31/09 (Level 1) (Level 2) (Level 3)
Derivative Assets 16$ -$ 16$ -$
Derivative Liabilities (75,371) - (75,371) -
Marketable Securities
(available for sale) 424 424 - -
Deferred Compensation
Plan Assets (a) 1,546 - 1,546 -
Total (73,385)$ 424$ (73,809)$ -$
(a) The Company also has an offsetting liability related to the Deferred Compensation Plan, which is not
disclosed in the table as it is not independently measured at fair value. The liability was not reported at
fair value as of the transition, but rather set to equal fair value of the assets held in the related rabbi trust.
Fair Value Measurements at Reporting Date Using
Total Fair Quoted Prices in Significant Other Significant
(in thousands) Value Assets Active Markets for Observable Unobservable
(Liabilities) Identical Assets Inputs Inputs
Description at 12/31/08 (Level 1) (Level 2) (Level 3)
Derivative Assets 63$ -$ 63$ -$
Derivative Liabilities (119,633) - (119,633) -
Marketable Securities
(available for sale) 348 348 - -
Deferred Compensation
Plan Assets (a) 352 - 352 -
Total (118,870)$ 348$ (119,218)$ -$
(a) The Company also has an offsetting liability related to the Deferred Compensation Plan, which is not
disclosed in the table as it is not independently measured at fair value. The liability was not reported at
fair value as of the transition, but rather set to equal fair value of the assets held in the related rabbi trust.
Note: Deferred Compensation Plan Liabilities, which were disclosed in the fair value disclosure table above
in the Consolidated Financial Statements for the year ended December 31, 2008 have been excluded
from the table and are disclosed in note (a) above.
Fair Value Measurements at Reporting Date Using
70