Thrifty Car Rental 2009 Annual Report Download - page 31
Download and view the complete annual report
Please find page 31 of the 2009 Thrifty Car Rental annual report below. You can navigate through the pages in the report by either clicking on the pages listed below, or by using the keyword search tool below to find specific information within the annual report.-
 1
1 -
2
-
3
-
4
-
5
-
6
-
7
-
8
-
9
-
10
-
11
-
12
-
13
-
14
-
15
-
16
-
17
-
18
-
19
-
20
-
 21
21 -
 22
22 -
 23
23 -
 24
24 -
 25
25 -
 26
26 -
 27
27 -
 28
28 -
 29
29 -
 30
30 -
 31
31 -
 32
32 -
 33
33 -
 34
34 -
 35
35 -
 36
36 -
 37
37 -
 38
38 -
 39
39 -
 40
40 -
 41
41 -
42
-
43
-
44
-
45
-
46
-
47
-
48
-
49
-
50
-
51
-
52
-
53
-
54
-
55
-
56
-
57
-
58
-
59
-
60
-
61
-
62
-
63
-
64
-
65
-
66
-
67
-
68
-
69
-
70
-
71
-
72
-
73
-
74
-
75
-
76
-
77
-
78
-
79
-
80
-
81
-
82
-
83
-
84
-
85
-
86
-
87
-
88
-
89
-
90
-
91
-
92
-
93
-
94
-
95
-
96
-
97
-
98
-
99
-
100
-
101
-
102
-
103
-
104
-
105
-
106
-
107
-
108
-
109
-
110
-
111
 |
 |

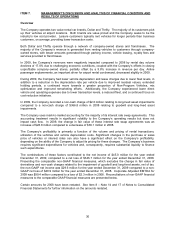
ITEM 7. MANAGEMENT’S DISCUSSION AND ANALYSIS OF FINANCIAL CONDITION AND
RESULTS OF OPERATIONS
Overview
The Company operates two value rental car brands, Dollar and Thrifty. The majority of its customers pick
up their vehicles at airport locations. Both brands are value priced and the Company seeks to be the
industry’s low cost provider. Leisure customers typically rent vehicles for longer periods than business
customers, on average, providing lower transaction costs.
Both Dollar and Thrifty operate through a network of company-owned stores and franchisees. The
majority of the Company’s revenue is generated from renting vehicles to customers through company-
owned stores, with lesser amounts generated through parking income, vehicle leasing, royalty fees and
services provided to franchisees.
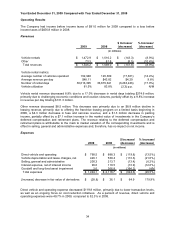
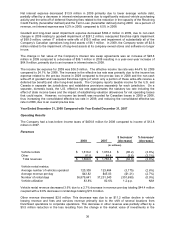
In 2009, the Company’s revenues were negatively impacted compared to 2008 by rental day volume
declines of 17.0% due to challenging economic conditions, coupled with the Company’s efforts in closing
unprofitable company-owned stores, partially offset by a 9.8% increase in revenue per day. Airline
passenger enplanements, an important driver for airport rental car demand, decreased slightly in 2009.
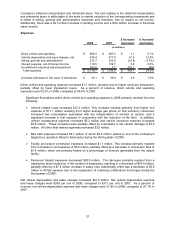
During 2009, the Company had lower vehicle depreciation and lease charges due to lower fleet levels, in
addition to a reduction in the depreciation rate per vehicle due to improved residual values, extended
holding periods, a continued move towards a greater proportion of Non-Program Vehicles, mix
optimization and improved remarketing efforts. Additionally, the Company experienced lower direct
vehicle and operating expenses due to lower transaction levels, a reduced fleet, and a continued focus on
cost reduction initiatives.
In 2009, the Company recorded a non-cash charge of $2.6 million relating to long-lived asset impairments
compared to a non-cash charge of $366.8 million in 2008 relating to goodwill and long-lived asset
impairments.
The Company uses mark-to-market accounting for the majority of its interest rate swap agreements. This
accounting treatment results in significant volatility to the Company’s operating results but does not
impact cash flow. In 2009, the change in fair value of these interest rate swap agreements was an
increase of $28.8 million compared to a decrease of $36.1 million in 2008.
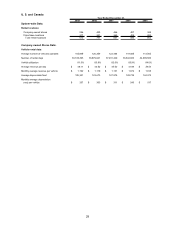
The Company’s profitability is primarily a function of the volume and pricing of rental transactions,
utilization of the vehicles and vehicle depreciation costs. Significant changes in the purchase or sales
price of vehicles or interest rates can also have a significant effect on the Company’s profitability,
depending on the ability of the Company to adjust its pricing for these changes. The Company’s business
requires significant expenditures for vehicles and, consequently, requires substantial liquidity to finance
such expenditures.
The combinations of these factors contributed to the net income of $45.0 million for the year ended
December 31, 2009, compared to a net loss of $346.7 million for the year ended December 31, 2008.
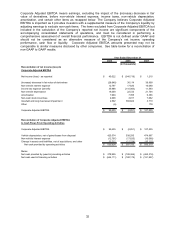
Presenting the comparable non-GAAP financial measures, which excludes the change in fair value of
derivatives and non-cash charges related to the impairment of goodwill and long-lived assets, net of tax,
the non-GAAP net income was $29.6 million for the year ended December 31, 2009 compared to a non-
GAAP net loss of $40.9 million for the year ended December 31, 2008. Corporate Adjusted EBITDA for
2009 was $99.4 million compared to a loss of $2.3 million in 2008. Reconciliations of non-GAAP financial
measures to the comparable GAAP financial measures are presented below.
Certain amounts for 2008 have been restated. See Item 8 – Note 14 and 17 of Notes to Consolidated
Financial Statements for further information on the amounts restated.
30