Thrifty Car Rental 2009 Annual Report Download - page 37
Download and view the complete annual report
Please find page 37 of the 2009 Thrifty Car Rental annual report below. You can navigate through the pages in the report by either clicking on the pages listed below, or by using the keyword search tool below to find specific information within the annual report.-
 1
1 -
2
-
3
-
4
-
5
-
6
-
7
-
8
-
9
-
10
-
11
-
12
-
13
-
14
-
15
-
16
-
17
-
18
-
19
-
20
-
21
-
22
-
23
-
24
-
25
-
26
-
 27
27 -
 28
28 -
 29
29 -
 30
30 -
 31
31 -
 32
32 -
 33
33 -
 34
34 -
 35
35 -
 36
36 -
 37
37 -
 38
38 -
 39
39 -
 40
40 -
 41
41 -
 42
42 -
 43
43 -
 44
44 -
 45
45 -
 46
46 -
 47
47 -
48
-
49
-
50
-
51
-
52
-
53
-
54
-
55
-
56
-
57
-
58
-
59
-
60
-
61
-
62
-
63
-
64
-
65
-
66
-
67
-
68
-
69
-
70
-
71
-
72
-
73
-
74
-
75
-
76
-
77
-
78
-
79
-
80
-
81
-
82
-
83
-
84
-
85
-
86
-
87
-
88
-
89
-
90
-
91
-
92
-
93
-
94
-
95
-
96
-
97
-
98
-
99
-
100
-
101
-
102
-
103
-
104
-
105
-
106
-
107
-
108
-
109
-
110
-
111
 |
 |

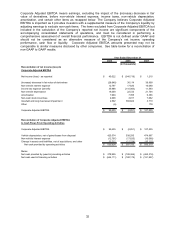
Net interest expense decreased $13.9 million in 2009 primarily due to lower average vehicle debt,
partially offset by a decrease in interest reimbursements due to significantly reduced vehicle purchasing
activity and the write-off of deferred financing fees related to the reduction in the capacity of the Revolving
Credit Facility (hereinafter defined) and the Term Loan (hereinafter defined) during 2009. As a percent of
revenue, net interest expense was 6.2% in 2009, compared to 6.5% in 2008.
Goodwill and long-lived asset impairment expense decreased $364.2 million in 2009, due to non-cash
charges in 2008 relating to goodwill impairment of $281.2 million, reacquired franchise rights impairment
of $69.0 million, certain IT initiative write-offs of $10.5 million and impairment of substantially all of the
Company’s Canadian operations long-lived assets of $6.1 million. In 2009, the Company wrote off $2.6
million related to the impairment of long-lived assets at its company-owned stores and software no longer
in use.
The change in fair value of the Company’s interest rate swap agreements was an increase of $28.8
million in 2009 compared to a decrease of $36.1 million in 2008 resulting in a year-over-year increase of
$64.9 million, primarily due to an increase in interest rates in 2009.
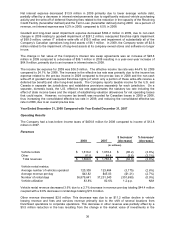
The income tax expense for 2009 was $36.0 million. The effective income tax rate was 44.4% for 2009
compared to 24.1% for 2008. The increase in the effective tax rate was primarily due to the income tax
expense related to the pre-tax income in 2009 compared to the pre-tax loss in 2008 and the non-cash
write-off of goodwill and reacquired franchise rights (of which only a portion of these write-offs receive a
deferred tax benefit) and other long-lived assets. The Company reports taxable income for the U.S. and
Canada in separate tax jurisdictions and establishes provisions separately for each jurisdiction. On a
separate, domestic basis, the U.S. effective tax rate approximates the statutory tax rate including the
effect of state income taxes and the impact of establishing valuation allowances for net operating losses
that could expire. However, no income tax benefit was recorded for Canadian losses in 2009 or 2008,
thus increasing the consolidated effective tax rate in 2009, and reducing the consolidated effective tax
rate in 2008, due to an overall pre-tax loss.
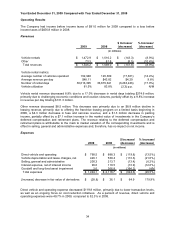
Year Ended December 31, 2008 Compared with Year Ended December 31, 2007
Operating Results
The Company had a loss before income taxes of $456.8 million for 2008 compared to income of $12.8
million in 2007.
Revenues
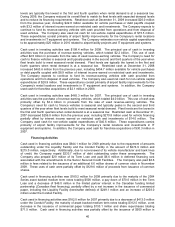
$ Increase/ % Increase/
2008 2007 (decrease) (decrease)
Vehicle rentals 1,616.2$ 1,676.4$ (60.2)$ (3.6%)
Other 81.8 84.4 (2.6) (3.1%)
Total revenues 1,698.0$ 1,760.8$ (62.8)$ (3.6%)
Vehicle rental metrics:
Average number of vehicles operated 120,309 123,484 (3,175) (2.6%)
Average revenue per day $43.82 $45.03 ($1.21) (2.7%)
Number of rental days 36,879,641 37,231,340 (351,699) (0.9%)
Vehicle utilization 83.8% 82.6% 1.2 p.p. N/M
(in millions)
Vehicle rental revenue decreased 3.6% due to a 2.7% decrease in revenue per day totaling $44.4 million
coupled with a 0.9% decrease in rental days totaling $15.8 million.
Other revenue decreased $2.6 million. This decrease was due to an $11.2 million decline in vehicle
leasing revenue and fees and services revenue primarily due to the shift of several locations from
franchised operations to corporate operations. This decrease in other revenue was partially offset by a
$5.5 million reduction in the loss resulting from the change in the market value of investments in the
36