Thrifty Car Rental 2008 Annual Report Download - page 84
Download and view the complete annual report
Please find page 84 of the 2008 Thrifty Car Rental annual report below. You can navigate through the pages in the report by either clicking on the pages listed below, or by using the keyword search tool below to find specific information within the annual report.-
 1
1 -
2
-
3
-
4
-
5
-
6
-
7
-
8
-
9
-
10
-
11
-
12
-
13
-
14
-
15
-
16
-
17
-
18
-
19
-
20
-
21
-
22
-
23
-
24
-
25
-
26
-
27
-
28
-
29
-
30
-
31
-
32
-
33
-
34
-
35
-
36
-
37
-
38
-
39
-
40
-
41
-
42
-
43
-
44
-
45
-
46
-
47
-
48
-
49
-
50
-
51
-
52
-
53
-
54
-
55
-
56
-
57
-
58
-
59
-
60
-
61
-
62
-
63
-
64
-
65
-
66
-
67
-
68
-
69
-
70
-
71
-
72
-
73
-
 74
74 -
 75
75 -
 76
76 -
 77
77 -
 78
78 -
 79
79 -
 80
80 -
 81
81 -
 82
82 -
 83
83 -
 84
84 -
 85
85 -
 86
86 -
 87
87 -
 88
88 -
 89
89 -
 90
90 -
 91
91 -
 92
92 -
 93
93 -
 94
94 -
95
-
96
-
97
-
98
-
99
-
100
-
101
-
102
-
103
-
104
-
105
-
106
-
107
-
108
-
109
-
110
-
111
-
112
-
113
-
114
-
115
 |
 |

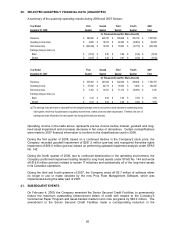
20. SELECTED QUARTERLY FINANCIAL DATA (UNAUDITED)
A summary of the quarterly operating results during 2008 and 2007 follows:
Year Ended First Second Third Fourth 2008
December 31, 2008 Quarter Quarter Quarter Quarter Total
Revenues 396,506$ 445,730$ 500,648$ 355,109$ 1,697,993$
Operating income (loss) 4,809$ 19,918$ 62,465$ (30,633)$ 56,559$
Net income (loss) (297,942)$ 10,765$ 18,933$ (72,178)$ (340,422)$
Earnings (loss) per share: (a)
Basic (14.07)$ 0.50$ 0.88$ (3.36)$ (15.93)$
Diluted (14.07)$ 0.49$ 0.87$ (3.36)$ (15.93)$
Year Ended First Second Third Fourth 2007
December 31, 2007 Quarter Quarter Quarter Quarter Total
Revenues 397,963$ 451,604$ 522,020$ 389,204$ 1,760,791$
Operating income 37,942$ 44,712$ 76,935$ 5,656$ 165,245$
Net income (loss) 5,162$ 15,321$ 11,313$ (30,581)$ 1,215$
Earnings (loss) per share: (a)
Basic 0.22$ 0.66$ 0.50$ (1.45)$ 0.05$
Diluted 0.21$ 0.63$ 0.48$ (1.45)$ 0.05$
(a) The earnings (loss) per share is calculated from the weighted average common and common stock equivalents outstanding during
each quarter, which may fluctuate based on quarterly income levels, market prices and share repurchases. Therefore, the sum of
earnings per share information for each quarter may not equal the total year amounts.
(In Thousands Except Per Share Amounts)
(In Thousands Except Per Share Amounts)
Operating income in the table above represents pre-tax income before interest, goodwill and long-
lived asset impairment and (increase) decrease in fair value of derivatives. Certain reclassifications
were made to 2007 financial information to conform to the classifications used in 2008.
During the first quarter of 2008, based on a continued decline in the Company’s stock price, the
Company recorded goodwill impairment of $281.2 million (pre-tax) and reacquired franchise rights
impairment of $69.0 million (pre-tax) based on performing updated impairment analysis under SFAS
No. 142.
During the fourth quarter of 2008, due to continued deterioration in the operating environment, the
Company performed impairment testing related to long-lived assets under SFAS No. 144 and wrote
off $16.6 million (pre-tax) related to certain IT initiatives and substantially all of the long-lived assets
in its Canadian operations.
During the third and fourth quarters of 2007, the Company wrote off $3.7 million of software either
no longer in use or made obsolete by the new Pros Fleet Management Software, which was
implemented during the latter part of 2007.
21. SUBSEQUENT EVENTS
On February 4, 2009, the Company amended the Senior Secured Credit Facilities, to permanently
reduce the maximum outstanding enhancement letters of credit with respect to the Company’s
Commercial Paper Program and asset-backed medium term note programs by $50.0 million. The
amendment to the Senior Secured Credit Facilities made a corresponding reduction in the
82