Thrifty Car Rental 2008 Annual Report Download - page 31
Download and view the complete annual report
Please find page 31 of the 2008 Thrifty Car Rental annual report below. You can navigate through the pages in the report by either clicking on the pages listed below, or by using the keyword search tool below to find specific information within the annual report.-
 1
1 -
2
-
3
-
4
-
5
-
6
-
7
-
8
-
9
-
10
-
11
-
12
-
13
-
14
-
15
-
16
-
17
-
18
-
19
-
20
-
 21
21 -
 22
22 -
 23
23 -
 24
24 -
 25
25 -
 26
26 -
 27
27 -
 28
28 -
 29
29 -
 30
30 -
 31
31 -
 32
32 -
 33
33 -
 34
34 -
 35
35 -
 36
36 -
 37
37 -
 38
38 -
 39
39 -
 40
40 -
 41
41 -
42
-
43
-
44
-
45
-
46
-
47
-
48
-
49
-
50
-
51
-
52
-
53
-
54
-
55
-
56
-
57
-
58
-
59
-
60
-
61
-
62
-
63
-
64
-
65
-
66
-
67
-
68
-
69
-
70
-
71
-
72
-
73
-
74
-
75
-
76
-
77
-
78
-
79
-
80
-
81
-
82
-
83
-
84
-
85
-
86
-
87
-
88
-
89
-
90
-
91
-
92
-
93
-
94
-
95
-
96
-
97
-
98
-
99
-
100
-
101
-
102
-
103
-
104
-
105
-
106
-
107
-
108
-
109
-
110
-
111
-
112
-
113
-
114
-
115
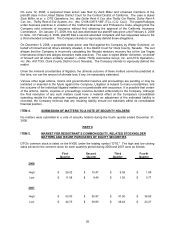
 |
 |

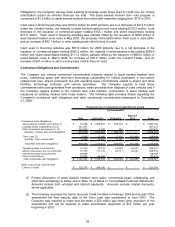
U. S. and Canada
2008 2007 2006 2005 2004
System-wide Data:
Rental locations:
Company-owned stores 400 466 407 369 352
Franchisee locations 341 365 429 483 507
Total rental locations 741 831 836 852 859
Average number of vehicles operated
during the period by company-owned
stores and franchisees 140,062 148,180 151,100 149,659 147,239
Peak number of vehicles operated
during the period by company-owned
stores and franchisees 166,300 178,415 185,317 183,291 179,304
Company-owned Stores Data:
V
ehicle rental data:
Average number of vehicles operated 120,309 123,484 119,648 113,002 102,159
Number of rental days 36,879,641 37,231,340 36,642,026 34,909,560 31,831,062
Vehicle utilization 83.8% 82.6% 83.9% 84.6% 85.1%
Average revenue per day 43.82$ 45.03$ 41.99$ 39.54$ 39.46$
Monthly average revenue per vehicle 1,119$ 1,131$ 1,072$ 1,018$ 1,024$
Average depreciable fleet 123,673 127,979 128,739 124,373 119,588
Monthly average depreciation
(net) per vehicle 363$ 311$ 246$ 197$ 220$
Year Ended December 31,
29