Thrifty Car Rental 2008 Annual Report Download - page 81
Download and view the complete annual report
Please find page 81 of the 2008 Thrifty Car Rental annual report below. You can navigate through the pages in the report by either clicking on the pages listed below, or by using the keyword search tool below to find specific information within the annual report.-
 1
1 -
2
-
3
-
4
-
5
-
6
-
7
-
8
-
9
-
10
-
11
-
12
-
13
-
14
-
15
-
16
-
17
-
18
-
19
-
20
-
21
-
22
-
23
-
24
-
25
-
26
-
27
-
28
-
29
-
30
-
31
-
32
-
33
-
34
-
35
-
36
-
37
-
38
-
39
-
40
-
41
-
42
-
43
-
44
-
45
-
46
-
47
-
48
-
49
-
50
-
51
-
52
-
53
-
54
-
55
-
56
-
57
-
58
-
59
-
60
-
61
-
62
-
63
-
64
-
65
-
66
-
67
-
68
-
69
-
70
-
 71
71 -
 72
72 -
 73
73 -
 74
74 -
 75
75 -
 76
76 -
 77
77 -
 78
78 -
 79
79 -
 80
80 -
 81
81 -
 82
82 -
 83
83 -
 84
84 -
 85
85 -
 86
86 -
 87
87 -
 88
88 -
 89
89 -
 90
90 -
 91
91 -
92
-
93
-
94
-
95
-
96
-
97
-
98
-
99
-
100
-
101
-
102
-
103
-
104
-
105
-
106
-
107
-
108
-
109
-
110
-
111
-
112
-
113
-
114
-
115
 |
 |

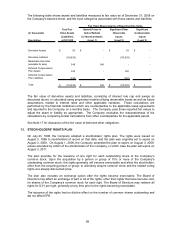
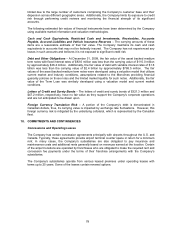
Expenses incurred under operating leases and concessions were as follows:
Year Ended December 31,
2008 2007 2006
(In Thousands)
Rent 51,535$ 49,270$ 42,493$
Concession expenses:
Minimum fees 94,678 87,416 70,656
Contingent fees 40,866 49,493 51,021
187,079 186,179 164,170
Less sublease rental income (1,078) (1,011) (867)
Total 186,001$ 185,168$ 163,303$
Future minimum rentals and fees under noncancelable operating leases and the Company’s
obligations for minimum airport concession fees at December 31, 2008 are presented in the
following table:
Company-Owned
Stores Operating
Concession Fees Leases Total
(In Thousands)
2009 75,153$ 57,010$ 132,163$
2010 60,650 43,841 104,491
2011 50,522 35,877 86,399
2012 45,637 29,362 74,999
2013 39,134 23,998 63,132
Thereafter 85,437 56,091 141,528
356,533 246,179 602,712
Less sublease rental income - (1,253) (1,253)
356,533$ 244,926$ 601,459$
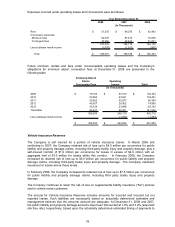
Vehicle Insurance Reserves
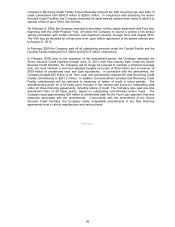
The Company is self insured for a portion of vehicle insurance claims. In March 2006 and
continuing in 2007, the Company retained risk of loss up to $4.0 million per occurrence for public
liability and property damage claims, including third-party bodily injury and property damage, plus a
self-insured corridor of $1.0 million per occurrence for losses in excess of $4.0 million with an
aggregate limit of $7.0 million for losses within this corridor. In February 2008, the Company
increased its retained risk of loss up to $5.0 million per occurrence for public liability and property
damage claims, including third-party bodily injury and property damage. The Company maintains
insurance for losses above these levels.
In February 2009, the Company increased its retained risk of loss up to $7.5 million per occurrence
for public liability and property damage claims, including third party bodily injury and property
damage.
The Company continues to retain the risk of loss on supplemental liability insurance (“SLI”) policies
sold to vehicle rental customers.
The accrual for Vehicle Insurance Reserves includes amounts for incurred and incurred but not
reported losses. Such liabilities are necessarily based on actuarially determined estimates and
management believes that the amounts accrued are adequate. At December 31, 2008 and 2007,
the public liability and property damage amounts have been discounted at 1.0% and 3.0% (assumed
risk free rate), respectively, based upon the actuarially determined estimated timing of payments to
79