Thrifty Car Rental 2008 Annual Report Download - page 53
Download and view the complete annual report
Please find page 53 of the 2008 Thrifty Car Rental annual report below. You can navigate through the pages in the report by either clicking on the pages listed below, or by using the keyword search tool below to find specific information within the annual report.-
 1
1 -
2
-
3
-
4
-
5
-
6
-
7
-
8
-
9
-
10
-
11
-
12
-
13
-
14
-
15
-
16
-
17
-
18
-
19
-
20
-
21
-
22
-
23
-
24
-
25
-
26
-
27
-
28
-
29
-
30
-
31
-
32
-
33
-
34
-
35
-
36
-
37
-
38
-
39
-
40
-
41
-
42
-
 43
43 -
 44
44 -
 45
45 -
 46
46 -
 47
47 -
 48
48 -
 49
49 -
 50
50 -
 51
51 -
 52
52 -
 53
53 -
 54
54 -
 55
55 -
 56
56 -
 57
57 -
 58
58 -
 59
59 -
 60
60 -
 61
61 -
 62
62 -
 63
63 -
64
-
65
-
66
-
67
-
68
-
69
-
70
-
71
-
72
-
73
-
74
-
75
-
76
-
77
-
78
-
79
-
80
-
81
-
82
-
83
-
84
-
85
-
86
-
87
-
88
-
89
-
90
-
91
-
92
-
93
-
94
-
95
-
96
-
97
-
98
-
99
-
100
-
101
-
102
-
103
-
104
-
105
-
106
-
107
-
108
-
109
-
110
-
111
-
112
-
113
-
114
-
115
 |
 |

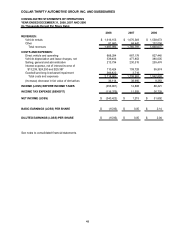
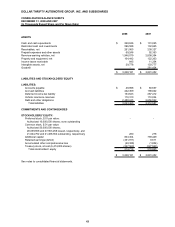
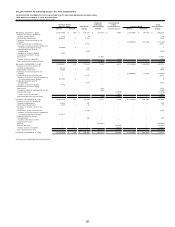
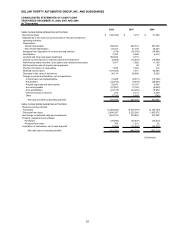
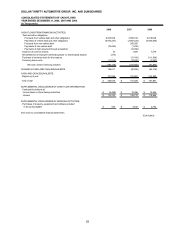
DOLLAR THRIFTY AUTOMOTIVE GROUP, INC. AND SUBSIDIARIES
CONSOLIDATED STATEMENTS OF CASH FLOWS
Y
EAR ENDED DECEMBER 31, 2008, 2007 AND 2006
(In Thousands)
2008 2007 2006
CASH FLOWS FROM OPERATING ACTIVITIES:
Net income (loss) (340,422)$ 1,215$ 51,692$
Adjustments to reconcile net income (loss) to net cash provided by
operating activities:
Depreciation:
Vehicle depreciation 539,024 493,712 387,350
Non-vehicle depreciation 22,722 21,704 20,343
Net gains from disposition of revenue-earning vehicles (774) (18,745) (14,491)
Amortization 7,355 6,386 6,410
Goodwill and long-lived asset impairment 366,822 3,719 -
Interest income earned on restricted cash and investments (8,922) (13,975) (16,896)
Performance share incentive, stock option and restricted stock plans 3,917 7,682 11,130
Net losses from sale of property and equipment - 66 63
Provision for losses on receivables 7,878 1,022 415
Deferred income taxes (118,403) 7,977 30,693
Decrease in fair value of derivatives 36,114 38,990 9,363
Change in assets and liabilities, net of acquisitions:
Income taxes receivable/payable 10,489 (8,577) (10,792)
Receivables (32,164) (9,478) (29,927)
Prepaid expenses and other assets 33,973 16,167 6,546
Accounts payable (27,931) 13,194 (8,930)
Accrued liabilities (24,175) (34,226) 15,956
Vehicle insurance reserves 276 6,113 3,308
Other (5,730) 4,364 (342)
Net cash provided by operating activities 470,049 537,310 461,891
CASH FLOWS FROM INVESTING ACTIVITIES:
Revenue-earning vehicles:
Purchases (2,282,562) (4,019,775) (4,182,123)
Proceeds from sales 2,606,587 3,372,366
3,387,672
Net change in restricted cash and investments (454,721) 270,824 412,392
Property, equipment and software:
Purchases (28,895) (40,647) (35,814)
Proceeds from sales 399 1,215 32
Acquisition of businesses, net of cash acquired (2,068) (30,292) (34,475)
Net cash used in investing activities (161,260) (446,309) (452,316)
(Continued)
51