Thrifty Car Rental 2008 Annual Report Download - page 39
Download and view the complete annual report
Please find page 39 of the 2008 Thrifty Car Rental annual report below. You can navigate through the pages in the report by either clicking on the pages listed below, or by using the keyword search tool below to find specific information within the annual report.-
 1
1 -
2
-
3
-
4
-
5
-
6
-
7
-
8
-
9
-
10
-
11
-
12
-
13
-
14
-
15
-
16
-
17
-
18
-
19
-
20
-
21
-
22
-
23
-
24
-
25
-
26
-
27
-
28
-
 29
29 -
 30
30 -
 31
31 -
 32
32 -
 33
33 -
 34
34 -
 35
35 -
 36
36 -
 37
37 -
 38
38 -
 39
39 -
 40
40 -
 41
41 -
 42
42 -
 43
43 -
 44
44 -
 45
45 -
 46
46 -
 47
47 -
 48
48 -
 49
49 -
50
-
51
-
52
-
53
-
54
-
55
-
56
-
57
-
58
-
59
-
60
-
61
-
62
-
63
-
64
-
65
-
66
-
67
-
68
-
69
-
70
-
71
-
72
-
73
-
74
-
75
-
76
-
77
-
78
-
79
-
80
-
81
-
82
-
83
-
84
-
85
-
86
-
87
-
88
-
89
-
90
-
91
-
92
-
93
-
94
-
95
-
96
-
97
-
98
-
99
-
100
-
101
-
102
-
103
-
104
-
105
-
106
-
107
-
108
-
109
-
110
-
111
-
112
-
113
-
114
-
115
 |
 |
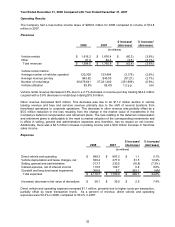
¾ Sales and marketing expense decreased $1.4 million due primarily to decreased Internet-related
spending and other marketing related costs.
¾ IT related expenses increased $27.3 million due to the outsourcing of IT services to EDS.
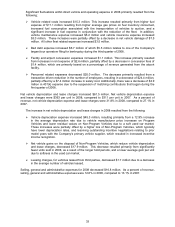
Net interest expense increased $13.7 million in 2007 primarily due to higher interest rates, higher average
debt, lower cash balances, and a $1.4 million write off of unamortized deferred financing fees related to
the retired revolving credit facility. These increases were partially offset by an increase in interest
reimbursements relating to vehicle programs. As a percent of revenue, net interest expense was 6.3% in
2007, compared to 5.8% in 2006.
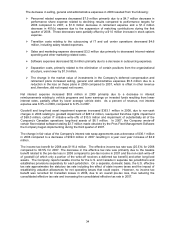
Long-lived asset impairment increased $3.7 million primarily due to a write off of software made obsolete
by the Pros Fleet Management Software the Company began implementing in the third quarter of 2007.
The change in fair value of the Company’s interest rate swap agreements was a decrease of $39.0 million
in 2007 compared to a decrease of $9.4 million in 2006 resulting in a year over year decrease of $29.6
million.
The income tax provision for 2007 was $11.6 million. The effective income tax rate was 90.5% for 2007
compared to 41.5% for 2006. The increase in the effective tax rate was due primarily to lower U.S. pretax
earnings in relationship to Canadian pretax losses. The Company reports taxable income for the U.S.
and Canada in separate tax jurisdictions and establishes provisions separately for each jurisdiction. On a
separate, domestic basis, the U.S. effective tax rate approximates the statutory tax rate including the
effect of state income taxes and the impact of establishing valuation allowances for net operating losses
that could expire. However, no income tax benefit was recorded for Canadian losses in 2007 or 2006,
thus, increasing the consolidated effective tax rate compared to the U.S. effective tax rate.
Liquidity and Capital Resources
The Company’s primary uses of liquidity are for the purchase of vehicles for its rental and leasing fleets,
non-vehicle capital expenditures, franchisee acquisitions and for working capital. The Company uses
both cash and letters of credit to support asset backed vehicle financing programs. The Company also
uses letters of credit or insurance bonds to secure certain commitments related to airport concession
agreements, insurance programs, and for other purposes. The Company’s primary sources of liquidity
are cash generated from operations, secured vehicle financing, the Senior Secured Credit Facilities and
insurance bonds.
During 2008, there were significant disruptions in the financial markets that affected the Company’s
access to funding. In 2008, the Company’s ability to access the commercial paper market was impaired
and it was entirely unable to access that market in the fourth quarter. The Company believes its access
to financing will continue to be severely limited in 2009.
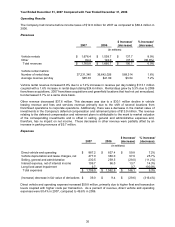
Operating Activities
Cash generated by operating activities of $470.0 million, $537.3 million and $461.9 million for 2008, 2007,
and 2006, respectively, are primarily the result of net income, adjusted for depreciation, goodwill
impairments net of deferred tax benefits in 2008 and the change in fair value of derivatives. The liquidity
necessary for purchasing vehicles is primarily obtained from secured vehicle financing, most of which is
proceeds from sale of asset backed medium term notes and asset backed commercial paper programs,
sales proceeds from disposal of used vehicles and cash generated by operating activities. The asset
backed medium term notes and commercial paper programs require varying levels of credit enhancement
or overcollateralization, which are provided by a combination of cash, vehicles, letters of credit and
proceeds from the Company’s term loan under the Senior Secured Credit Facilities (as amended, the
“Term Loan”). These letters of credit are provided under the Company’s Revolving Credit Facility.
The Company believes that its cash generated from operations, cash balances, availability under its
Revolving Credit Facility, insurance bonding programs and secured vehicle financing programs are
adequate to meet its liquidity requirements during 2009. The Company’s existing asset backed medium
term notes are expected to be sufficient to meet 2009 vehicle financing requirements. The asset backed
medium term notes have varying maturities from 2010 through 2012. The Company generally issues
additional asset backed medium term notes each year to increase or replace maturing vehicle financing
37