Thrifty Car Rental 2008 Annual Report Download - page 54
Download and view the complete annual report
Please find page 54 of the 2008 Thrifty Car Rental annual report below. You can navigate through the pages in the report by either clicking on the pages listed below, or by using the keyword search tool below to find specific information within the annual report.-
 1
1 -
2
-
3
-
4
-
5
-
6
-
7
-
8
-
9
-
10
-
11
-
12
-
13
-
14
-
15
-
16
-
17
-
18
-
19
-
20
-
21
-
22
-
23
-
24
-
25
-
26
-
27
-
28
-
29
-
30
-
31
-
32
-
33
-
34
-
35
-
36
-
37
-
38
-
39
-
40
-
41
-
42
-
43
-
 44
44 -
 45
45 -
 46
46 -
 47
47 -
 48
48 -
 49
49 -
 50
50 -
 51
51 -
 52
52 -
 53
53 -
 54
54 -
 55
55 -
 56
56 -
 57
57 -
 58
58 -
 59
59 -
 60
60 -
 61
61 -
 62
62 -
 63
63 -
 64
64 -
65
-
66
-
67
-
68
-
69
-
70
-
71
-
72
-
73
-
74
-
75
-
76
-
77
-
78
-
79
-
80
-
81
-
82
-
83
-
84
-
85
-
86
-
87
-
88
-
89
-
90
-
91
-
92
-
93
-
94
-
95
-
96
-
97
-
98
-
99
-
100
-
101
-
102
-
103
-
104
-
105
-
106
-
107
-
108
-
109
-
110
-
111
-
112
-
113
-
114
-
115
 |
 |

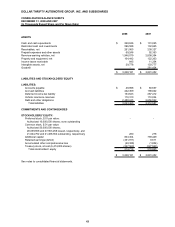
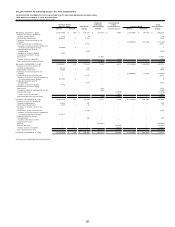
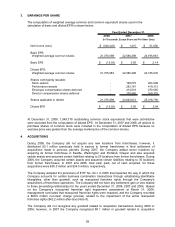
DOLLAR THRIFTY AUTOMOTIVE GROUP, INC. AND SUBSIDIARIES
CONSOLIDATED STATEMENTS OF CASH FLOWS
YEAR ENDED DECEMBER 31, 2008, 2007 AND 2006
(In Thousands)
2008 2007 2006
CASH FLOWS FROM FINANCING ACTIVITIES:
Debt and other obligations:
Proceeds from vehicle debt and other obligations 9,874,526 3,650,743 6,619,828
Payments of vehicle debt and other obligations (9,972,227) (3,987,224) (6,600,505)
Proceeds from non-vehicle debt - 250,000 -
Payments of non-vehicle debt (70,625) (1,250) -
Payments of debt assumed through acquisition - (14,092) -
Issuance of common shares 33 1,669 7,479
Net settlement of employee withholding taxes on share-based awards (373) - -
Purchase of common stock for the treasury - (71,543) (111,308)
Financing issue costs (11,512) (10,260) (7,387)
Net cash used in financing activities (180,178) (181,957) (91,893)
CHANGE IN CASH AND CASH EQUIVALENTS 128,611 (90,956) (82,318)
CASH AND CASH EQUIVALENTS:
Beginning of year 101,025 191,981 274,299
End of year 229,636$ 101,025$ 191,981$
SUPPLEMENTAL DISCLOSURES OF CASH FLOW INFORMATION:
Cash paid for/(refund of):
Income taxes to (from) taxing authorities (8,486)$ 12,396$ 15,246$
Interest 114,753$ 128,779$ 118,886$
SUPPLEMENTAL DISCLOSURES OF NONCASH ACTIVITIES:
Purchases of property, equipment and software included
in accounts payable 924$ 4,632$ 2,752$
See notes to consolidated financial statements.
(Concluded)
52