Thrifty Car Rental 2008 Annual Report Download - page 34
Download and view the complete annual report
Please find page 34 of the 2008 Thrifty Car Rental annual report below. You can navigate through the pages in the report by either clicking on the pages listed below, or by using the keyword search tool below to find specific information within the annual report.-
 1
1 -
2
-
3
-
4
-
5
-
6
-
7
-
8
-
9
-
10
-
11
-
12
-
13
-
14
-
15
-
16
-
17
-
18
-
19
-
20
-
21
-
22
-
23
-
 24
24 -
 25
25 -
 26
26 -
 27
27 -
 28
28 -
 29
29 -
 30
30 -
 31
31 -
 32
32 -
 33
33 -
 34
34 -
 35
35 -
 36
36 -
 37
37 -
 38
38 -
 39
39 -
 40
40 -
 41
41 -
 42
42 -
 43
43 -
 44
44 -
45
-
46
-
47
-
48
-
49
-
50
-
51
-
52
-
53
-
54
-
55
-
56
-
57
-
58
-
59
-
60
-
61
-
62
-
63
-
64
-
65
-
66
-
67
-
68
-
69
-
70
-
71
-
72
-
73
-
74
-
75
-
76
-
77
-
78
-
79
-
80
-
81
-
82
-
83
-
84
-
85
-
86
-
87
-
88
-
89
-
90
-
91
-
92
-
93
-
94
-
95
-
96
-
97
-
98
-
99
-
100
-
101
-
102
-
103
-
104
-
105
-
106
-
107
-
108
-
109
-
110
-
111
-
112
-
113
-
114
-
115
 |
 |

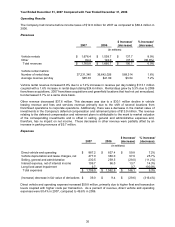
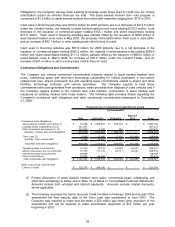
Year Ended December 31, 2008 Compared with Year Ended December 31, 2007
Operating Results
The Company had a loss before income taxes of $456.8 million for 2008 compared to income of $12.8
million in 2007.
Revenues
$ Increase/ % Increase/
2008 2007 (decrease) (decrease)
Vehicle rentals 1,616.2$ 1,676.4$ (60.2)$ (3.6%)
Other 81.8 84.4 (2.6) (3.1%)
Total revenues 1,698.0$ 1,760.8$ (62.8)$ (3.6%)
Vehicle rental metrics:
Average number of vehicles operated 120,309 123,484 (3,175) (2.6%)
Average revenue per day $43.82 $45.03 ($1.21) (2.7%)
Number of rental days 36,879,641 37,231,340 (351,699) (0.9%)
Vehicle utilization 83.8% 82.6% 1.2 p.p. n/m
(in millions)
Vehicle rental revenue decreased 3.6% due to a 2.7% decrease in revenue per day totaling $44.4 million
coupled with a 0.9% decrease in rental days totaling $15.8 million.
Other revenue decreased $2.6 million. This decrease was due to an $11.2 million decline in vehicle
leasing revenue and fees and services revenue primarily due to the shift of several locations from
franchised operations to corporate operations. This decrease in other revenue was partially offset by a
$5.5 million reduction in the loss resulting from the change in the market value of investments in the
Company’s deferred compensation and retirement plans. The loss relating to the deferred compensation
and retirement plans is attributable to the mark to market valuation of the corresponding investments and
is offset in selling, general and administrative expenses and, therefore, has no impact on net income.
Additionally, there was a $2.5 million increase in parking income and a $0.6 million increase in franchise
sales income.
Expenses
$ Increase/ % Increase/
2008 2007 (decrease) (decrease)
Direct vehicle and operating 888.3$ 887.2$ 1.1$ 0.1%
Vehicle depreciation and lease charges, net 539.4 477.9 61.5 12.9%
Selling, general and administrative 213.7 230.5 (16.8) (7.3%)
Interest expense, net of interest income 110.5 109.7 0.8 0.6%
Goodwill and long-lived asset impairment 366.8 3.7 363.1 N/M
Total expenses 2,118.7$ 1,709.0$ 409.7$ 24.0%
(Increase) decrease in fair value of derivatives 36.1$ 39.0$ 2.9$ 7.4%
(in millions)
Direct vehicle and operating expense increased $1.1 million, primarily due to higher costs per transaction,
partially offset by lower transaction levels. As a percent of revenue, direct vehicle and operating
expenses were 52.3% in 2008, compared to 50.4% in 2007.
32