Thrifty Car Rental 2008 Annual Report Download - page 33
Download and view the complete annual report
Please find page 33 of the 2008 Thrifty Car Rental annual report below. You can navigate through the pages in the report by either clicking on the pages listed below, or by using the keyword search tool below to find specific information within the annual report.-
 1
1 -
2
-
3
-
4
-
5
-
6
-
7
-
8
-
9
-
10
-
11
-
12
-
13
-
14
-
15
-
16
-
17
-
18
-
19
-
20
-
21
-
22
-
 23
23 -
 24
24 -
 25
25 -
 26
26 -
 27
27 -
 28
28 -
 29
29 -
 30
30 -
 31
31 -
 32
32 -
 33
33 -
 34
34 -
 35
35 -
 36
36 -
 37
37 -
 38
38 -
 39
39 -
 40
40 -
 41
41 -
 42
42 -
 43
43 -
44
-
45
-
46
-
47
-
48
-
49
-
50
-
51
-
52
-
53
-
54
-
55
-
56
-
57
-
58
-
59
-
60
-
61
-
62
-
63
-
64
-
65
-
66
-
67
-
68
-
69
-
70
-
71
-
72
-
73
-
74
-
75
-
76
-
77
-
78
-
79
-
80
-
81
-
82
-
83
-
84
-
85
-
86
-
87
-
88
-
89
-
90
-
91
-
92
-
93
-
94
-
95
-
96
-
97
-
98
-
99
-
100
-
101
-
102
-
103
-
104
-
105
-
106
-
107
-
108
-
109
-
110
-
111
-
112
-
113
-
114
-
115
 |
 |

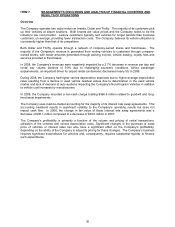
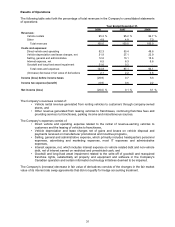
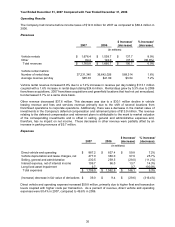
Results of Operations
The following table sets forth the percentage of total revenues in the Company’s consolidated statements
of operations:
Revenues:
Vehicle rentals 95.2 % 95.2 % 92.7 %
Other 4.8 4.8 7.3
Total revenues 100.0 100.0 100.0
Costs and expenses:
Direct vehicle and operating 52.3 50.4 49.8
Vehicle depreciation and lease charges, net 31.8 27.1 22.9
Selling, general and administrative 12.6 13.1 15.6
Interest expense, net 6.5 6.3 5.8
Goodwill and long-lived asset impairment 21.6 0.2 -
Total costs and expenses 124.8 97.1 94.1
(Increase) decrease in fair value of derivatives 2.1 2.2 0.6
Income (loss) before income taxes (26.9) 0.7 5.3
Income tax expense (benefit) (6.9) 0.6 2.2
Net income (loss) (20.0) % 0.1 % 3.1 %
Year Ended December 31,
2008 2007 2006
The Company’s revenues consist of:
• Vehicle rental revenue generated from renting vehicles to customers through company-owned
stores, and
• Other revenue generated from leasing vehicles to franchisees, continuing franchise fees and
providing services to franchisees, parking income and miscellaneous sources.
The Company’s expenses consist of:
• Direct vehicle and operating expense related to the rental of revenue-earning vehicles to
customers and the leasing of vehicles to franchisees,
• Vehicle depreciation and lease charges net of gains and losses on vehicle disposal and
payments received on manufacturer promotional and incentive programs,
• Selling, general and administrative expense, which primarily includes headquarters personnel
expenses, advertising and marketing expenses, most IT expenses and administrative
expenses,
• Interest expense, net, which includes interest expense on vehicle related debt and non-vehicle
debt, net of interest earned on restricted and unrestricted cash, and
• Goodwill and long-lived asset impairment related to the write-off of goodwill and reacquired
franchise rights, substantially all property and equipment and software in the Company’s
Canadian operation and certain information technology initiatives deemed to be impaired.
The Company’s (increase) decrease in fair value of derivatives consists of the changes in the fair market
value of its interest rate swap agreements that did not qualify for hedge accounting treatment.
31