Symantec 2003 Annual Report Download - page 47
Download and view the complete annual report
Please find page 47 of the 2003 Symantec annual report below. You can navigate through the pages in the report by either clicking on the pages listed below, or by using the keyword search tool below to find specific information within the annual report.
Symantec 2003 45
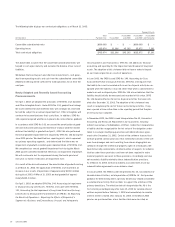
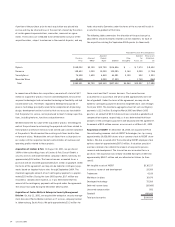
Symantec Corporation Consolidated Statements of Operations
Year Ended March 31,
(IN THOUSANDS, EXCEPT NET INCOME (LOSS) PER SHARE) 2003 2002 2001
Net revenues $1,406,946 $1,071,438 $853,554
Cost of revenues 250,116 195,903 131,999
Gross margin 1,156,830 875,535 721,555
Operating expenses:
Research and development 197,271 163,979 126,673
Sales and marketing 525,029 425,951 341,456
General and administrative 74,442 55,131 45,110
Amortization of goodwill –196,806 71,336
Amortization of other intangibles from acquisitions 2,787 2,144 1,416
Acquired in-process research and development 4,700 –22,300
Restructuring, site closures and other 11,089 20,428 3,664
Litigation judgment –3,055 –
Total operating expenses 815,318 867,494 611,955
Operating income 341,512 8,041 109,600
Interest income 37,704 31,717 33,257
Interest expense (21,166) (9,169) –
Income, net of expense, from sale of technologies and product lines 6,878 15,536 20,448
Other expense, net (1,297) (627) (22,525)
Income before income taxes 363,631 45,498 140,780
Provision for income taxes 115,193 73,649 76,844
Net income (loss) $248,438 $(28,151) $ 63,936
Net income (loss) per share – basic $1.71 $(0.20) $ 0.49
Net income (loss) per share – diluted $1.54 $(0.20) $ 0.47
Shares used to compute net income (loss) per share – basic 145,395 143,604 129,474
Shares used to compute net income (loss) per share – diluted 170,718 143,604 136,474
The accompanying Summary of Significant Accounting Policies and Notes to Consolidated Financial Statements are an integral part of these statements.


