Symantec 2003 Annual Report Download - page 36
Download and view the complete annual report
Please find page 36 of the 2003 Symantec annual report below. You can navigate through the pages in the report by either clicking on the pages listed below, or by using the keyword search tool below to find specific information within the annual report.-
 1
1 -
2
-
3
-
4
-
5
-
6
-
7
-
8
-
9
-
10
-
11
-
12
-
13
-
14
-
15
-
16
-
17
-
18
-
19
-
20
-
21
-
22
-
23
-
24
-
25
-
 26
26 -
 27
27 -
 28
28 -
 29
29 -
 30
30 -
 31
31 -
 32
32 -
 33
33 -
 34
34 -
 35
35 -
 36
36 -
 37
37 -
 38
38 -
 39
39 -
 40
40 -
 41
41 -
 42
42 -
 43
43 -
 44
44 -
 45
45 -
 46
46 -
47
-
48
-
49
-
50
-
51
-
52
-
53
-
54
-
55
-
56
-
57
-
58
-
59
-
60
-
61
-
62
-
63
-
64
-
65
-
66
-
67
-
68
-
69
-
70
-
71
-
72
-
73
-
74
-
75
-
76
 |
 |

34 Symantec 2003
American support group to Springfield, Oregon. As a result, we recorded
approximately $17.8 million for exit costs, including $12.8 million in
rent and related exit costs remaining on the abandoned facilities and
$5.0 million in related abandoned fixed asset and leasehold improve-
ment write-offs. In addition, we recorded approximately $2.6 million for
costs of severance, related benefits and outplacement services, as we
reorganized various operating functions, including former AXENT opera-
tions, and terminated 87 employees.
During fiscal 2001, we reorganized various operating functions, includ-
ing a portion of our operations in Toronto. We terminated 60 employees
and ten members of our senior management, and as a result, we
recorded approximately $3.7 million for costs of severance, related ben-
efits, outplacement services and abandonment of certain equipment.
LITIGATION JUDGMENT
During the March 2002 quarter, we accrued litigation expenses of
approximately $3.1 million for post-judgment interest and other costs
related to a judgment by a Canadian court on a decade-old copyright
action assumed by us as a result of our acquisition of Delrina
Corporation. There was no corresponding accrual during fiscal 2003
or fiscal 2001.
OPERATING INCOME
Operating income was approximately $341.5 million, $8.0 million and
$109.6 million during fiscal 2003, 2002 and 2001, respectively. The
primary factor in the increase between fiscal 2002 and 2003 was our
adoption of SFAS No. 142. As a result, in fiscal 2003, we recorded no
amortization of goodwill, compared with a charge of $196.8 million dur-
ing fiscal 2002. In addition, strength in major foreign currencies during
fiscal 2003, as compared to the average major foreign currency rates
during fiscal 2002, positively impacted our operating income growth by
approximately $19.9 million. Weakness in major foreign currencies dur-
ing fiscal 2002, as compared to the average major foreign currency rates
during fiscal 2001, negatively impacted our operating income growth
by approximately $12.1 million. We are unable to predict the extent to
which operating income in future periods will be impacted by changes
in foreign currency rates.
INTEREST INCOME, INTEREST EXPENSE AND OTHER EXPENSE, NET
Interest income was approximately $37.7 million, $31.7 million and
$33.3 million during fiscal 2003, 2002 and 2001, respectively. The
increase was due to higher average invested cash balances during fiscal
2003 as compared to fiscal 2002. Although interest income was rela-
tively flat during fiscal 2002 and fiscal 2001, average cash balances
were higher during fiscal 2002 as compared to fiscal 2001, which was
offset by a decrease in average interest rates.
Interest expense was approximately $21.2 million and $9.2 million dur-
ing fiscal 2003 and 2002, respectively, nearly all of which was related to
the issuance of $600.0 million of 3% convertible subordinated notes in
October 2001. Interest expense was not significant during fiscal 2001.
Other expense, net of approximately $1.3 million and $0.6 million
during fiscal 2003 and 2002, respectively, was primarily comprised of
net losses from non-functional currency transactions. Other expense,
net was approximately $22.5 million during fiscal 2001 and consisted
primarily of impairment charges on our equity investments.
INCOME, NET OF EXPENSE, FROM SALE OF TECHNOLOGIES AND
PRODUCT LINES
Income, net of expense, from sale of technologies and product lines was
approximately $6.9 million, $15.5 million and $20.4 million during fiscal
2003, 2002 and 2001, respectively. During fiscal 2003, 2002 and 2001,
income, net of expense, from sale of technologies and product lines was
related primarily to royalty payments received, in connection with the
divestiture of our ACT! product line in December 1999, from Interact
Commerce Corporation, which subsequently merged with The Sage
Group plc. During fiscal 2003, this royalty income was offset by the
write-off of approximately $2.7 million of developed technology related
to the Web access management products that were divested in the
September 2001 quarter.
INCOME TAXES
Our effective tax rate on income before taxes was approximately 32%,
162% and 55% during fiscal 2003, 2002 and 2001, respectively. The
higher effective tax rate in fiscal 2002 and 2001 reflects the non-
deductibility of acquired in-process research and development and
substantially all of the goodwill amortization.
Realization of our net deferred tax asset at March 31, 2003 is depend-
ent primarily upon future U.S. taxable income and our implementation
of tax planning strategies. We believe it is more likely than not that the
net deferred tax assets will be realized based on historical earnings and
expected levels of future taxable income as well as the implementation
of tax planning strategies.
Levels of future taxable income are subject to the various risks and
uncertainties discussed in the Business Risk Factors. An additional valu-
ation allowance against net deferred tax assets may be necessary if it is
more likely than not that all or a portion of the net deferred tax assets
will not be realized. We will assess the need for an additional valuation
allowance on a quarterly basis.
We project our effective tax rate to be 32% for fiscal 2004. This projec-
tion, however, is subject to change due to potential tax law changes and
fluctuations in the geographic distribution of earnings.
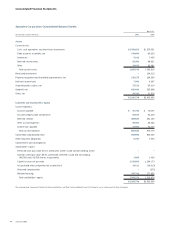
LIQUIDITY AND CAPITAL RESOURCES
Our principal source of liquidity is our cash, cash equivalents and short-
term investments as well as the cash that we generate over time from
our operations. Cash, cash equivalents and short-term investments
increased $330.6 million to approximately $1.7 billion at the end of
fiscal 2003 from $1.4 billion at the end of fiscal 2002. This increase is
primarily due to cash provided by operations, net proceeds from the