Symantec 2003 Annual Report Download - page 4
Download and view the complete annual report
Please find page 4 of the 2003 Symantec annual report below. You can navigate through the pages in the report by either clicking on the pages listed below, or by using the keyword search tool below to find specific information within the annual report.-
 1
1 -
 2
2 -
 3
3 -
 4
4 -
 5
5 -
 6
6 -
 7
7 -
 8
8 -
 9
9 -
 10
10 -
 11
11 -
 12
12 -
 13
13 -
 14
14 -
 15
15 -
16
-
17
-
18
-
19
-
20
-
21
-
22
-
23
-
24
-
25
-
26
-
27
-
28
-
29
-
30
-
31
-
32
-
33
-
34
-
35
-
36
-
37
-
38
-
39
-
40
-
41
-
42
-
43
-
44
-
45
-
46
-
47
-
48
-
49
-
50
-
51
-
52
-
53
-
54
-
55
-
56
-
57
-
58
-
59
-
60
-
61
-
62
-
63
-
64
-
65
-
66
-
67
-
68
-
69
-
70
-
71
-
72
-
73
-
74
-
75
-
76
 |
 |
2Symantec 2003
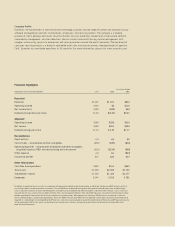
Fiscal 2003 was another year of record performance for our
company. We launched many exciting new products, significantly
enhanced our direct sales force, and continued to aggressively
promote our brand. As a result, we surpassed our target for
revenue growth and earnings per share. In a year when most
companies hunkered down and waited for the economy to recover,
Symantec demonstrated its strengths—our diverse customer base,
our broad product portfolio, and our global reach—and grew
faster than the industry.
Our success is the result of the strategic path we embarked
on four years ago to address the real problems customers are
facing with information security: managing the growing cost and
complexity of the vast array of security technologies deployed
throughout their networks. Symantec’s approach of product inte-
gration and enterprise-level management will help our customers
lower the total cost of ownership, simplify the management of
security technologies, and, for the first time, give customers a more
comprehensive view of their networked security environment.
A RECORD YEAR
Our global sales team marked another year of outstanding per-
formance, producing double-digit revenue growth in every region.
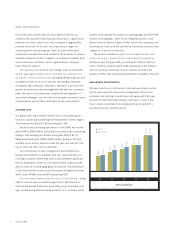
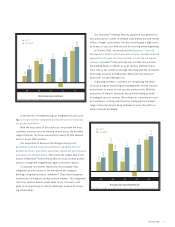
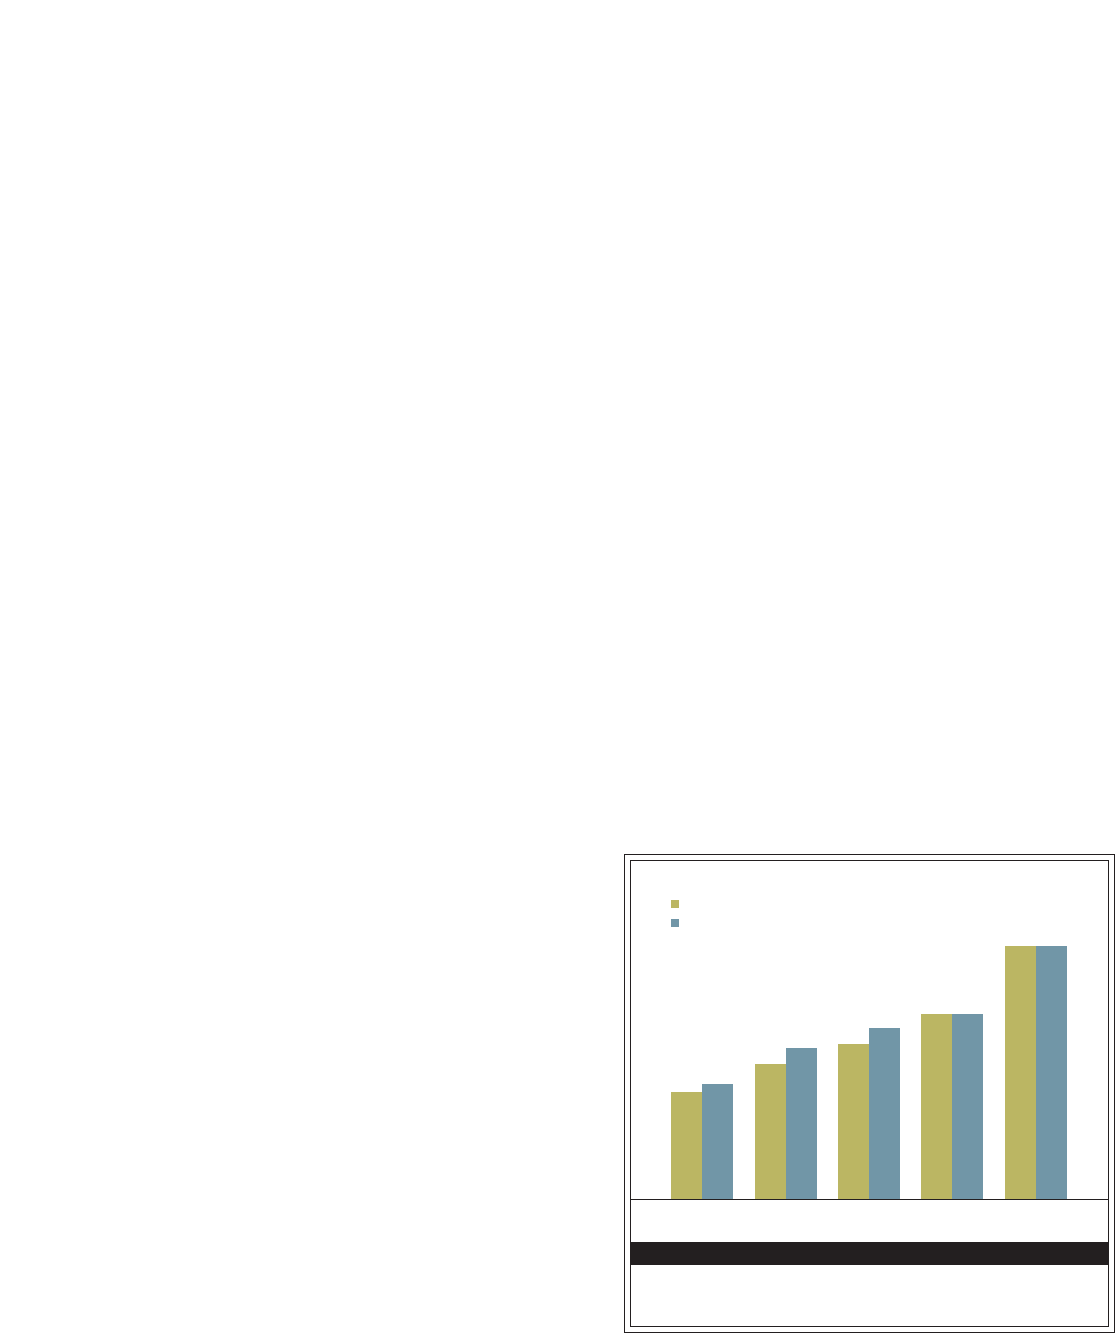
Total revenue reached $1.4 billion and grew 31%.
Results from continuing operations or non-GAAP net income
grew 40% to $280 million, excluding acquisition and restructuring
charges, and earnings per diluted share grew 32% to $1.72.
Deferred revenue grew 78% to $590 million, giving us the best
visibility in our history. And we closed the year with over $1.7 bil-
lion in cash and short-term investments.
Our investments in sales management and execution are
paying real dividends on a global scale. Our continued focus on
reaching customers where they want to buy delivered significant
returns allowing our electronic distribution sales to grow 214%.
And, in the face of challenging global economies, the momentum
of our international business units increased throughout the year
with Europe, Middle East and Africa growing 42%.
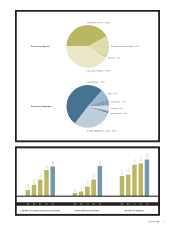
Our consumer segment was the year’s star performer, rising
52% to surpass even our wildest expectations. We focused on
maintaining market leadership, expanding our go-to-market strat-
egy, and delivering award-winning products. Our consumer devel-
opment team shipped 20 products in 18 languages and 900 OEM
builds in 20 languages. Sales of our integrated product suite,
Norton Internet Security™, grew 101%—proof that consumers are
choosing our brand, and the confidence it provides to protect their
“always-on” Internet connections.
We posted a number of significant competitive wins and
continued to gain market share in the enterprise segments.
Enterprise security grew 30%, accounting for 42% of total rev-
enues. Antivirus solutions grew 33%, well ahead of the industry.
And non-antivirus enterprise security solutions posted solid
growth of 21%, with accelerating momentum throughout the year.
NEW GROWTH OPPORTUNITIES
We view security as a continuum—from early warning to protec-
tion to rapid response and overall management. More of our
customers are starting to understand and agree with this view.
As many of them have experienced, a few days’ or even a few
hours’ advance warning of an emerging threat can prevent a
possible disastrous network attack.
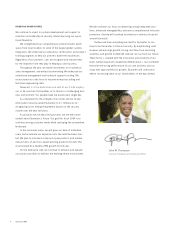
Dear Shareholders,
Revenue (millions)
Reconciliations of GAAP and non-GAAP measures may be found on the inside cover of this annual report
GAAP
non-GAAP
99 00 01 02 03
$593
$632
$746
$827
$854
$944
$1,071
$1,071
$1,407
$1,407