Supercuts 2011 Annual Report Download - page 85
Download and view the complete annual report
Please find page 85 of the 2011 Supercuts annual report below. You can navigate through the pages in the report by either clicking on the pages listed below, or by using the keyword search tool below to find specific information within the annual report.-
 1
1 -
2
-
3
-
4
-
5
-
6
-
7
-
8
-
9
-
10
-
11
-
12
-
13
-
14
-
15
-
16
-
17
-
18
-
19
-
20
-
21
-
22
-
23
-
24
-
25
-
26
-
27
-
28
-
29
-
30
-
31
-
32
-
33
-
34
-
35
-
36
-
37
-
38
-
39
-
40
-
41
-
42
-
43
-
44
-
45
-
46
-
47
-
48
-
49
-
50
-
51
-
52
-
53
-
54
-
55
-
56
-
57
-
58
-
59
-
60
-
61
-
62
-
63
-
64
-
65
-
66
-
67
-
68
-
69
-
70
-
71
-
72
-
73
-
74
-
 75
75 -
 76
76 -
 77
77 -
 78
78 -
 79
79 -
 80
80 -
 81
81 -
 82
82 -
 83
83 -
 84
84 -
 85
85 -
 86
86 -
 87
87 -
 88
88 -
 89
89 -
 90
90 -
 91
91 -
 92
92 -
 93
93 -
 94
94 -
 95
95 -
96
-
97
-
98
-
99
-
100
-
101
-
102
-
103
-
104
-
105
-
106
-
107
-
108
-
109
-
110
-
111
-
112
-
113
-
114
-
115
-
116
-
117
-
118
-
119
-
120
-
121
-
122
-
123
-
124
-
125
-
126
-
127
-
128
-
129
-
130
-
131
-
132
-
133
-
134
-
135
-
136
-
137
-
138
-
139
-
140
-
141
-
142
-
143
-
144
-
145
-
146
-
147
-
148
-
149
-
150
-
151
-
152
-
153
-
154
-
155
-
156
-
157
-
158
-
159
-
160
-
161
-
162
-
163
-
164
-
165
-
166
-
167
-
168
-
169
-
170
-
171
-
172
-
173
-
174
-
175
-
176
-
177
-
178
 |
 |

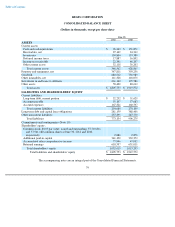
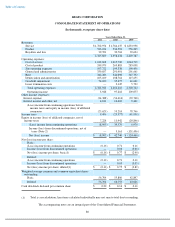
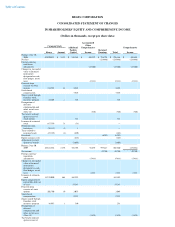
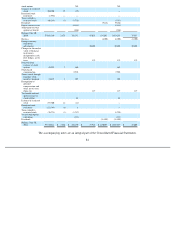
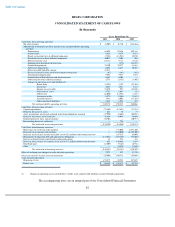
The accompanying notes are an integral part of the Consolidated Financial Statements.
81
stock options
262
262
Issuance of restricted
stock
304,200
15
(15
)
—
Restricted stock
forfeitures
(1,976
)
—
—
—
Taxes related to
restricted stock
(66,161
)
(3
)
(1,710
)
(1,713
)
Dividends
(9,146
)
(9,146
)
Equity issuance costs
(8,154
)
(8,154
)
Adjustment to stock
option tax benefit
(264
)
(264
)
Balance, June 30,
2010
57,561,180
2,878
332,372
47,032
631,011
1,013,293
37,917
Net loss
(8,905
)
(8,905
)
(8,905
)
Foreign currency
translation
adjustments
30,405
30,405
30,405
Changes in fair market
value of financial
instruments
designated as cash
flow hedges, net of
taxes
132
132
132
Proceeds from
exercise of stock
options
45,933
2
680
682
Stock-based
compensation
9,596
9,596
Shares issued through
franchise stock
incentive program
24,472
1
397
398
Recognition of
deferred
compensation and
other, net of taxes
(Note 14)
377
377
377
Tax benefit realized
upon exercise of
stock options
67
67
Issuance of restricted
stock
277,300
14
(14
)
—
Restricted stock
forfeitures
(121,343
)
(6
)
6
—
Taxes related to
restricted stock
(76,731
)
(3
)
(1,787
)
(1,790
)
Vested stock option
expirations
(127
)
(127
)
Dividends
(11,509
)
(11,509
)
Balance, June 30,
2011
57,710,811
$
2,886
$
341,190
$
77,946
$
610,597
$
1,032,619
$
22,009