Supercuts 2011 Annual Report Download - page 58
Download and view the complete annual report
Please find page 58 of the 2011 Supercuts annual report below. You can navigate through the pages in the report by either clicking on the pages listed below, or by using the keyword search tool below to find specific information within the annual report.-
 1
1 -
2
-
3
-
4
-
5
-
6
-
7
-
8
-
9
-
10
-
11
-
12
-
13
-
14
-
15
-
16
-
17
-
18
-
19
-
20
-
21
-
22
-
23
-
24
-
25
-
26
-
27
-
28
-
29
-
30
-
31
-
32
-
33
-
34
-
35
-
36
-
37
-
38
-
39
-
40
-
41
-
42
-
43
-
44
-
45
-
46
-
47
-
 48
48 -
 49
49 -
 50
50 -
 51
51 -
 52
52 -
 53
53 -
 54
54 -
 55
55 -
 56
56 -
 57
57 -
 58
58 -
 59
59 -
 60
60 -
 61
61 -
 62
62 -
 63
63 -
 64
64 -
 65
65 -
 66
66 -
 67
67 -
 68
68 -
69
-
70
-
71
-
72
-
73
-
74
-
75
-
76
-
77
-
78
-
79
-
80
-
81
-
82
-
83
-
84
-
85
-
86
-
87
-
88
-
89
-
90
-
91
-
92
-
93
-
94
-
95
-
96
-
97
-
98
-
99
-
100
-
101
-
102
-
103
-
104
-
105
-
106
-
107
-
108
-
109
-
110
-
111
-
112
-
113
-
114
-
115
-
116
-
117
-
118
-
119
-
120
-
121
-
122
-
123
-
124
-
125
-
126
-
127
-
128
-
129
-
130
-
131
-
132
-
133
-
134
-
135
-
136
-
137
-
138
-
139
-
140
-
141
-
142
-
143
-
144
-
145
-
146
-
147
-
148
-
149
-
150
-
151
-
152
-
153
-
154
-
155
-
156
-
157
-
158
-
159
-
160
-
161
-
162
-
163
-
164
-
165
-
166
-
167
-
168
-
169
-
170
-
171
-
172
-
173
-
174
-
175
-
176
-
177
-
178
 |
 |

Table of Contents
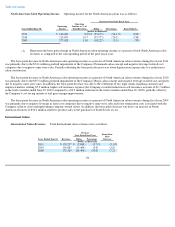
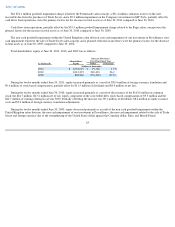
Constant Currency Presentation
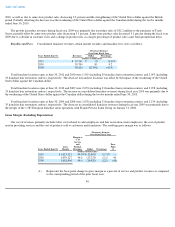
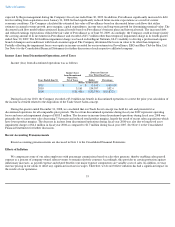
The presentation below demonstrates the effect of foreign currency exchange rate fluctuations from year to year. To present this
information, current period results for entities reporting in currencies other than United States dollars are converted into United States dollars at
the average exchange rates in effect during the corresponding period of the prior fiscal year, rather than the actual average exchange rates in
effect during the current fiscal year. Therefore, the foreign currency impact is equal to current year results in local currencies multiplied by the
change in the average foreign currency exchange rate between the current fiscal period and the corresponding period of the prior fiscal year.
During the fiscal year ended June 30, 2011, foreign currency translation had a favorable impact on consolidated revenues due to the
strengthening of the Canadian dollar and British Pound against the United States dollar.
During the fiscal year ended June 30, 2010, foreign currency translation had a favorable impact on consolidated revenues due to the
strengthening of the Canadian dollar against the United States dollar, partially offset by the weakening of the British pound and Euro against the
United States dollar.
During the fiscal year ended June 30, 2009, foreign currency translation had an unfavorable impact on consolidated revenues due to the
weakening of the Canadian dollar, British pound, and Euro against the United States dollar.
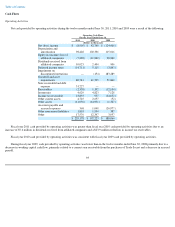
Results of Operations by Segment
Based on our internal management structure, we report three segments: North American salons, International salons and Hair Restoration
Centers. Significant results of operations are discussed below with respect to each of these segments.
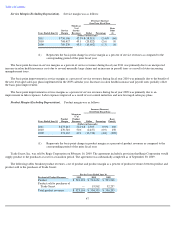
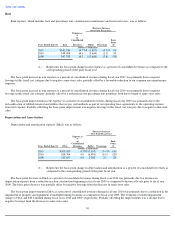
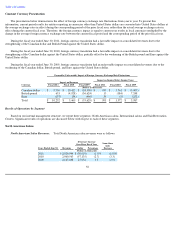
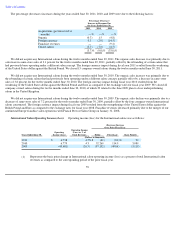
North American Salons
North American Salon Revenues. Total North American salon revenues were as follows:
56
Favorable (Unfavorable) Impact of Foreign Currency Exchange Rate Fluctuations
Impact on Income Before Income Taxes
Impact on Revenues
Fiscal 2011 Fiscal 2010
Currency Fiscal 2011 Fiscal 2010 Fiscal 2009 Fiscal 2009
(Dollars in thousands)
Canadian dollar
$
9,736
$
10,422
$
(18,509
)
$
937
$
1,761
$
(3,009
)
British pound
653
(4,928
)
(36,624
)
15
(184
)
7,248
Euro
(137
)
(34
)
(496
)
39
(5
)
(252
)
Total
$
10,252
$
5,460
$
(55,629
)
$
991
$
1,572
$
3,987
(Decrease) Increase
Over Prior Fiscal Year
Same-Store
Sales
Decrease
Years Ended June 30,
Revenues
Dollar
Percentage
(Dollars in thousands)
2011
$
2,029,944
$
(30,619
)
(1.5
)%
(1.8
)%
2010
2,060,563
(57,135
)
(2.7
)
(3.3
)
2009
2,117,698
27,952
1.3
(2.9
)