Supercuts 2011 Annual Report Download - page 49
Download and view the complete annual report
Please find page 49 of the 2011 Supercuts annual report below. You can navigate through the pages in the report by either clicking on the pages listed below, or by using the keyword search tool below to find specific information within the annual report.-
 1
1 -
2
-
3
-
4
-
5
-
6
-
7
-
8
-
9
-
10
-
11
-
12
-
13
-
14
-
15
-
16
-
17
-
18
-
19
-
20
-
21
-
22
-
23
-
24
-
25
-
26
-
27
-
28
-
29
-
30
-
31
-
32
-
33
-
34
-
35
-
36
-
37
-
38
-
 39
39 -
 40
40 -
 41
41 -
 42
42 -
 43
43 -
 44
44 -
 45
45 -
 46
46 -
 47
47 -
 48
48 -
 49
49 -
 50
50 -
 51
51 -
 52
52 -
 53
53 -
 54
54 -
 55
55 -
 56
56 -
 57
57 -
 58
58 -
 59
59 -
60
-
61
-
62
-
63
-
64
-
65
-
66
-
67
-
68
-
69
-
70
-
71
-
72
-
73
-
74
-
75
-
76
-
77
-
78
-
79
-
80
-
81
-
82
-
83
-
84
-
85
-
86
-
87
-
88
-
89
-
90
-
91
-
92
-
93
-
94
-
95
-
96
-
97
-
98
-
99
-
100
-
101
-
102
-
103
-
104
-
105
-
106
-
107
-
108
-
109
-
110
-
111
-
112
-
113
-
114
-
115
-
116
-
117
-
118
-
119
-
120
-
121
-
122
-
123
-
124
-
125
-
126
-
127
-
128
-
129
-
130
-
131
-
132
-
133
-
134
-
135
-
136
-
137
-
138
-
139
-
140
-
141
-
142
-
143
-
144
-
145
-
146
-
147
-
148
-
149
-
150
-
151
-
152
-
153
-
154
-
155
-
156
-
157
-
158
-
159
-
160
-
161
-
162
-
163
-
164
-
165
-
166
-
167
-
168
-
169
-
170
-
171
-
172
-
173
-
174
-
175
-
176
-
177
-
178
 |
 |

Table of Contents
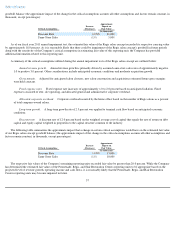
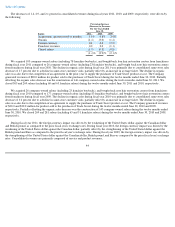
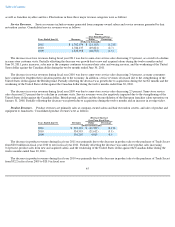
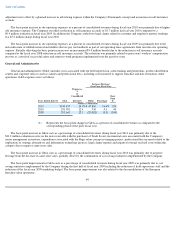
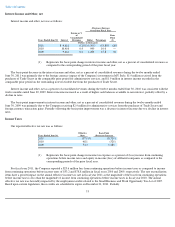
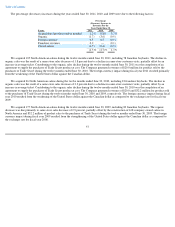
Service Margin (Excluding Depreciation). Service margin was as follows:
The basis point decrease in service margins as a percent of service revenues during fiscal year 2011 was primarily due to an unexpected
increase in salon health insurance costs due to several unusually large claims and an increase in payroll taxes as a result of states increasing
unemployment taxes.
The basis point improvement in service margins as a percent of service revenues during fiscal year 2010 was primarily due to the benefit of
the new leveraged salon pay plans implemented in the 2009 calendar year. Increases in salon health insurance and payroll taxes partially offset
the basis point improvement.
The basis point improvement in service margins as a percent of service revenues during fiscal year 2009 was primarily due to an
improvement in labor expenses. Labor expenses improved as a result of cost control initiatives and new leveraged salon pay plans.
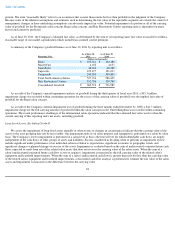
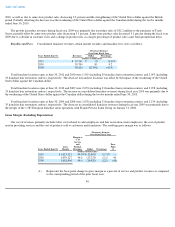
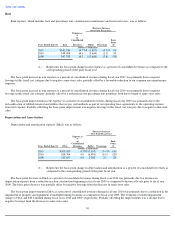
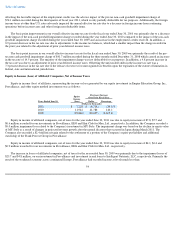
Product Margin (Excluding Depreciation). Product margin was as follows:
Trade Secret, Inc. was sold by Regis Corporation on February 16, 2009. The agreement included a provision that Regis Corporation would
supply product to the purchaser at cost for a transition period. The agreement was substantially completed as of September 30, 2009.
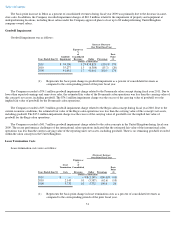
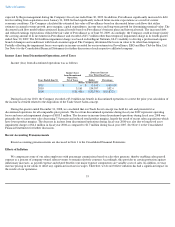
The following tables breakout product revenues, cost of product and product margin as a percent of product revenues between product and
product sold to the purchaser of Trade Secret.
47
(Decrease) Increase
Over Prior Fiscal Year
Years Ended June 30,
Service
Margin
Margin as
% of
Service
Revenues Dollar
Percentage
Basis
Point
(1)
(Dollars in thousands)
2011
$
750,106
42.5
%
$
(18,311
)
(2.4
)%
(60
)
2010
768,417
43.1
(20,822
)
(2.6
)
10
2009
789,239
43.0
(10,692
)
(1.3
)
10
(1) Represents the basis point change in service margin as a percent of service revenues as compared to the
corresponding period of the prior fiscal year.
Increase (Decrease)
Over Prior Fiscal Year
Years Ended June 30,
Product
Margin
Margin as
% of
Product
Revenues
Dollar
Percentage
Basis
Point(1)
(Dollars in thousands)
2011
$
273,215
52.2
%
$
2,505
0.9
%
160
2010
270,710
50.6
(2,457
)
(0.9
)
150
2009
273,167
49.1
(13,728
)
(4.8
)
(290
)
(1) Represents the basis point change in product margin as a percent of product revenues as compared to the
corresponding period of the prior fiscal year.
For the Years Ended June 30,
Breakout of Product Revenues
2011
2010
2009
Product
$
523,194
$
514,631
$
523,968
Product sold to purchaser of
Trade Secret
—
19,962
32,237
Total product revenues
$
523,194
$
534,593
$
556,205