Supercuts 2011 Annual Report Download - page 146
Download and view the complete annual report
Please find page 146 of the 2011 Supercuts annual report below. You can navigate through the pages in the report by either clicking on the pages listed below, or by using the keyword search tool below to find specific information within the annual report.-
 1
1 -
2
-
3
-
4
-
5
-
6
-
7
-
8
-
9
-
10
-
11
-
12
-
13
-
14
-
15
-
16
-
17
-
18
-
19
-
20
-
21
-
22
-
23
-
24
-
25
-
26
-
27
-
28
-
29
-
30
-
31
-
32
-
33
-
34
-
35
-
36
-
37
-
38
-
39
-
40
-
41
-
42
-
43
-
44
-
45
-
46
-
47
-
48
-
49
-
50
-
51
-
52
-
53
-
54
-
55
-
56
-
57
-
58
-
59
-
60
-
61
-
62
-
63
-
64
-
65
-
66
-
67
-
68
-
69
-
70
-
71
-
72
-
73
-
74
-
75
-
76
-
77
-
78
-
79
-
80
-
81
-
82
-
83
-
84
-
85
-
86
-
87
-
88
-
89
-
90
-
91
-
92
-
93
-
94
-
95
-
96
-
97
-
98
-
99
-
100
-
101
-
102
-
103
-
104
-
105
-
106
-
107
-
108
-
109
-
110
-
111
-
112
-
113
-
114
-
115
-
116
-
117
-
118
-
119
-
120
-
121
-
122
-
123
-
124
-
125
-
126
-
127
-
128
-
129
-
130
-
131
-
132
-
133
-
134
-
135
-
 136
136 -
 137
137 -
 138
138 -
 139
139 -
 140
140 -
 141
141 -
 142
142 -
 143
143 -
 144
144 -
 145
145 -
 146
146 -
 147
147 -
 148
148 -
 149
149 -
 150
150 -
 151
151 -
 152
152 -
 153
153 -
 154
154 -
 155
155 -
 156
156 -
157
-
158
-
159
-
160
-
161
-
162
-
163
-
164
-
165
-
166
-
167
-
168
-
169
-
170
-
171
-
172
-
173
-
174
-
175
-
176
-
177
-
178
 |
 |

Table of Contents
NOTES TO CONSOLIDATED FINANCIAL STATEMENTS (Continued)
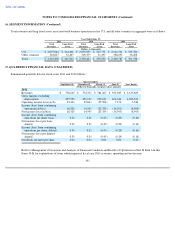
16. SEGMENT INFORMATION (Continued)
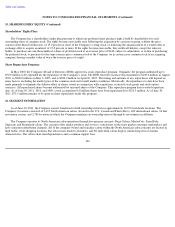
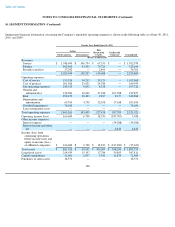
Total revenues and long-lived assets associated with business operations in the U.S. and all other countries in aggregate were as follows:
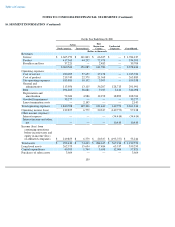
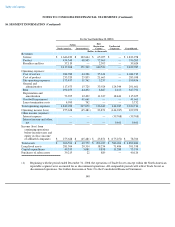
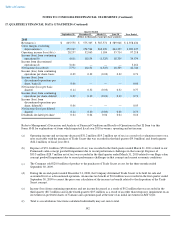
17. QUARTERLY FINANCIAL DATA (UNAUDITED)
Summarized quarterly data for fiscal years 2011 and 2010 follows:
141
Year Ended June 30,
2011
2010
2009
Total
Revenues
Long
-
lived
Assets
Total
Revenues
Long
-
lived
Assets
Total
Revenues
Long
-
lived
Assets
(Dollars in thousands)
U.S.
$
2,007,042
$
314,406
$
2,055,059
$
327,753
$
2,121,531
$
355,330
Other countries
318,827
33,405
303,375
31,497
308,256
36,208
Total
$
2,325,869
$
347,811
$
2,358,434
$
359,250
$
2,429,787
$
391,538
Quarter Ended
September 30
December 31
March 31
June 30
Year Ended
(Dollars in thousands, except per share amounts)
2011
Revenues
$
578,245
$
574,372
$
581,267
$
591,985
$
2,325,869
Gross margin, excluding
depreciation
257,558
251,132
253,017
261,614
1,023,321
Operating income (loss)(a)(b)
33,434
22,864
(59,504
)
7,154
3,948
Income (loss) from continuing
operations(a)(b)(e)
18,320
14,505
(25,335
)
(16,395
)
(8,905
)
Net income (loss)(a)(b)(e)
18,320
14,505
(25,335
)
(16,395
)
(8,905
)
Income (loss) from continuing
operations per share, basic
0.32
0.26
(0.45
)
(0.29
)
(0.16
)
Net income (loss) per basic
share(f)
0.32
0.26
(0.45
)
(0.29
)
(0.16
)
Income (loss) from continuing
operations per share, diluted
0.30
0.24
(0.45
)
(0.29
)
(0.16
)
Net income (loss) per diluted
share(f)
0.30
0.24
(0.45
)
(0.29
)
(0.16
)
Dividends declared per share
0.04
0.04
0.06
0.06
0.20
Refer to Management's Discussion and Analysis of Financial Condition and Results of Operations in Part II, Item 6 in this
Form 10
-
K for explanations of items which impacted fiscal year 2011 revenues, operating and net income.