Supercuts 2011 Annual Report Download - page 50
Download and view the complete annual report
Please find page 50 of the 2011 Supercuts annual report below. You can navigate through the pages in the report by either clicking on the pages listed below, or by using the keyword search tool below to find specific information within the annual report.-
 1
1 -
2
-
3
-
4
-
5
-
6
-
7
-
8
-
9
-
10
-
11
-
12
-
13
-
14
-
15
-
16
-
17
-
18
-
19
-
20
-
21
-
22
-
23
-
24
-
25
-
26
-
27
-
28
-
29
-
30
-
31
-
32
-
33
-
34
-
35
-
36
-
37
-
38
-
39
-
 40
40 -
 41
41 -
 42
42 -
 43
43 -
 44
44 -
 45
45 -
 46
46 -
 47
47 -
 48
48 -
 49
49 -
 50
50 -
 51
51 -
 52
52 -
 53
53 -
 54
54 -
 55
55 -
 56
56 -
 57
57 -
 58
58 -
 59
59 -
 60
60 -
61
-
62
-
63
-
64
-
65
-
66
-
67
-
68
-
69
-
70
-
71
-
72
-
73
-
74
-
75
-
76
-
77
-
78
-
79
-
80
-
81
-
82
-
83
-
84
-
85
-
86
-
87
-
88
-
89
-
90
-
91
-
92
-
93
-
94
-
95
-
96
-
97
-
98
-
99
-
100
-
101
-
102
-
103
-
104
-
105
-
106
-
107
-
108
-
109
-
110
-
111
-
112
-
113
-
114
-
115
-
116
-
117
-
118
-
119
-
120
-
121
-
122
-
123
-
124
-
125
-
126
-
127
-
128
-
129
-
130
-
131
-
132
-
133
-
134
-
135
-
136
-
137
-
138
-
139
-
140
-
141
-
142
-
143
-
144
-
145
-
146
-
147
-
148
-
149
-
150
-
151
-
152
-
153
-
154
-
155
-
156
-
157
-
158
-
159
-
160
-
161
-
162
-
163
-
164
-
165
-
166
-
167
-
168
-
169
-
170
-
171
-
172
-
173
-
174
-
175
-
176
-
177
-
178
 |
 |

Table of Contents
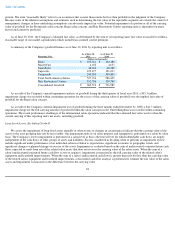
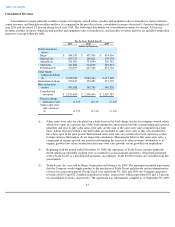
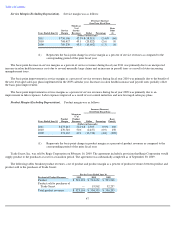
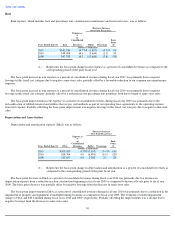
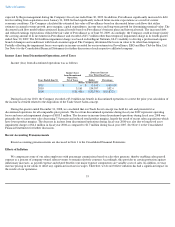
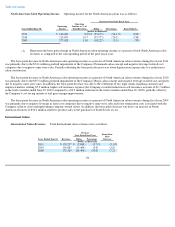
The basis point decrease in product margin other than sold to purchaser of Trade Secret as a percentage of product revenues during fiscal
year 2011 was primarily due to an increase in sales of slightly lower
-profit margin appliances in our International segment and an increase in the
cost of hair systems in our Hair Restoration Centers segment, partially offset by reduced commissions paid to new employees on retail product
sales in our North American segment.
The basis point improvement in product margin other than sold to purchaser of Trade Secret as a percentage of product revenues during
fiscal year 2010 was due to a planned reduction in retail commissions paid to new employees on retail product sales.
The basis point improvement in product margin other than sold to purchaser of Trade Secret as a percentage of product revenues during
fiscal year 2009 was due to selling higher cost inventories in fiscal year 2008 obtained in conjunction with several acquisitions. In addition,
product margins improved due to the deconsolidation of the European franchise salon operations and a write-off of slow moving inventories in
fiscal year 2008. Partially offsetting the improvement was mix play, as a larger than expected percentage of product sales came from lower-
margin promotional items. We are not promoting or discounting at a higher rate, but we are continuing to see customers be more value-focused
through buying promotional items at a higher rate than prior periods.
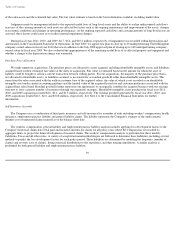
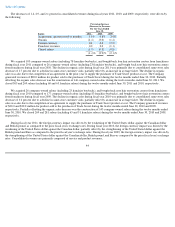
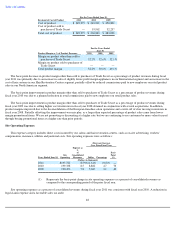
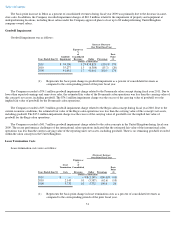
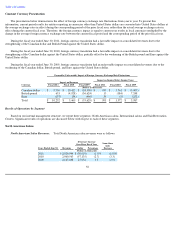
Site Operating Expenses
This expense category includes direct costs incurred by our salons and hair restoration centers, such as on-site advertising, workers'
compensation, insurance, utilities and janitorial costs. Site operating expenses were as follows:
Site operating expenses as a percent of consolidated revenues during fiscal year 2011 was consistent with fiscal year 2010. A reduction in
legal claims expense and a favorable sales tax audit
48
For the Years Ended June 30,
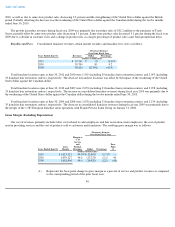
Breakout of Cost of Product
2011
2010
2009
Cost of product
$
249,979
$
243,921
$
250,801
Cost of product sold to
purchaser of Trade Secret
—
19,962
32,237
Total cost of product
$
249,979
$
263,883
$
283,038
For the Years Ended
June 30,
Product Margin as % of Product Revenues
2011
2010
2009
Margin on product other than sold to
purchaser of Trade Secret
52.2
%
52.6
%
52.1
%
Margin on product sold to purchaser of
Trade Secret
—
—
—
Total product margin
52.2
%
50.6
%
49.1
%
(Decrease) Increase
Over Prior Fiscal Year
Years Ended June 30,
Site
Operating
Expense as
%
of
Consolidated
Revenues
Dollar
Percentage
Basis
Point
(1)
(Dollars in thousands)
2011
$
197,722
8.5
%
$
(1,616
)
(0.8
)%
—
2010
199,338
8.5
8,882
4.7
70
2009
190,456
7.8
5,687
3.1
40
(1) Represents the basis point change in site operating expenses as a percent of consolidated revenues as
compared to the corresponding period of the prior fiscal year.