Supercuts 2011 Annual Report Download - page 52
Download and view the complete annual report
Please find page 52 of the 2011 Supercuts annual report below. You can navigate through the pages in the report by either clicking on the pages listed below, or by using the keyword search tool below to find specific information within the annual report.-
 1
1 -
2
-
3
-
4
-
5
-
6
-
7
-
8
-
9
-
10
-
11
-
12
-
13
-
14
-
15
-
16
-
17
-
18
-
19
-
20
-
21
-
22
-
23
-
24
-
25
-
26
-
27
-
28
-
29
-
30
-
31
-
32
-
33
-
34
-
35
-
36
-
37
-
38
-
39
-
40
-
41
-
 42
42 -
 43
43 -
 44
44 -
 45
45 -
 46
46 -
 47
47 -
 48
48 -
 49
49 -
 50
50 -
 51
51 -
 52
52 -
 53
53 -
 54
54 -
 55
55 -
 56
56 -
 57
57 -
 58
58 -
 59
59 -
 60
60 -
 61
61 -
 62
62 -
63
-
64
-
65
-
66
-
67
-
68
-
69
-
70
-
71
-
72
-
73
-
74
-
75
-
76
-
77
-
78
-
79
-
80
-
81
-
82
-
83
-
84
-
85
-
86
-
87
-
88
-
89
-
90
-
91
-
92
-
93
-
94
-
95
-
96
-
97
-
98
-
99
-
100
-
101
-
102
-
103
-
104
-
105
-
106
-
107
-
108
-
109
-
110
-
111
-
112
-
113
-
114
-
115
-
116
-
117
-
118
-
119
-
120
-
121
-
122
-
123
-
124
-
125
-
126
-
127
-
128
-
129
-
130
-
131
-
132
-
133
-
134
-
135
-
136
-
137
-
138
-
139
-
140
-
141
-
142
-
143
-
144
-
145
-
146
-
147
-
148
-
149
-
150
-
151
-
152
-
153
-
154
-
155
-
156
-
157
-
158
-
159
-
160
-
161
-
162
-
163
-
164
-
165
-
166
-
167
-
168
-
169
-
170
-
171
-
172
-
173
-
174
-
175
-
176
-
177
-
178
 |
 |

Table of Contents
Rent
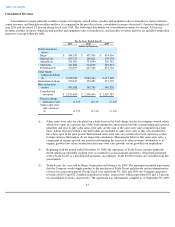
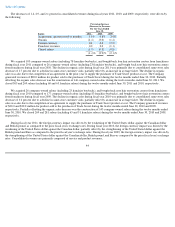
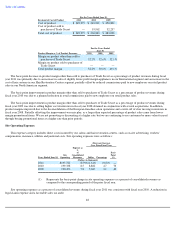
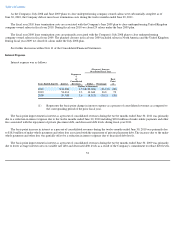
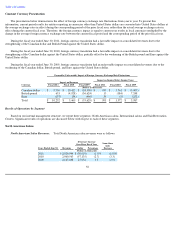
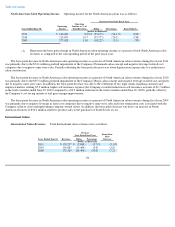
Rent expense, which includes base and percentage rent, common area maintenance and real estate taxes, was as follows:
The basis point increase in rent expense as a percent of consolidated revenues during fiscal year 2011 was primarily due to negative
leverage in this fixed cost category due to negative same-store sales, partially offset by a favorable reduction to our common area maintenance
expenses.
The basis point increase in rent expense as a percent of consolidated revenues during fiscal year 2010 was primarily due to negative
leverage in this fixed cost category, partially offset by a reduction in our percentage rent payments, both due to negative same-store sales.
The basis point improvement in rent expense as a percent of consolidated revenues during fiscal year 2009 was primarily due to the
reclassification of rubbish removal and utilities that we pay our landlords as part of our operating lease agreements to site operating expense
from rent expense. Partially offsetting the basis point improvement was negative leverage in this fixed cost category due to negative same-store
sales.
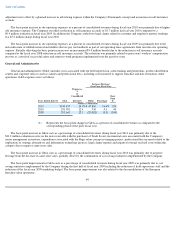
Depreciation and Amortization
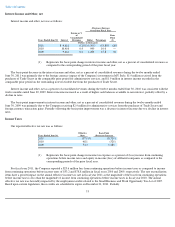
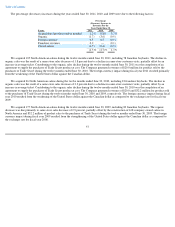
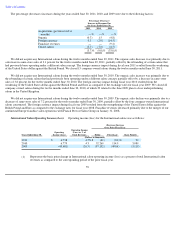
Depreciation and amortization expense (D&A) was as follows:
The basis point decrease in D&A as a percent of consolidated revenues during fiscal year 2011 was primarily due to a decrease in
depreciation expense from a reduction in salon construction beginning in fiscal year 2009 as compared to historical levels prior to fiscal year
2009. The basis point decrease was partially offset by negative leverage from the decrease in same-store sales.
The basis point improvement in D&A as a percent of consolidated revenues during fiscal year 2010 was primarily due to a reduction in the
impairment of property and equipment at underperforming locations as compared to fiscal year 2009. The Company recorded impairment
charges of $6.4 and $10.2 million during fiscal years 2010 and 2009, respectively. Partially offsetting the improvements was a decline due to
negative leverage from the decrease in same-store sales.
50
(Decrease) Increase
Over Prior Fiscal Year
Years Ended June 30,
Rent
Expense as
%
of
Consolidated
Revenues Dollar
Percentage
Basis
Point
(1)
(Dollars in thousands)
2011
$
342,286
14.7
%
$
(1,812
)
(0.5
)%
10
2010
344,098
14.6
(3,694
)
(1.1
)
30
2009
347,792
14.3
(13,684
)
(3.8
)
(30
)
(1) Represents the basis point change in rent expense as a percent of consolidated revenues as compared to the
corresponding period of the prior fiscal year.
(Decrease) Increase
Over Prior Fiscal Year
Years Ended June 30,
D&A
Expense as
%
of
Consolidated
Revenues
Dollar
Percentage
Basis
Point
(1)
(Dollars in thousands)
2011
$
105,109
4.5
%
$
(3,655
)
(3.4
)%
(10
)
2010
108,764
4.6
(6,891
)
(6.0
)
(20
)
2009
115,655
4.8
2,362
2.1
20
(1) Represents the basis point change in depreciation and amortization as a percent of consolidated revenues as
compared to the corresponding period of the prior fiscal year.