Supercuts 2011 Annual Report Download - page 117
Download and view the complete annual report
Please find page 117 of the 2011 Supercuts annual report below. You can navigate through the pages in the report by either clicking on the pages listed below, or by using the keyword search tool below to find specific information within the annual report.-
 1
1 -
2
-
3
-
4
-
5
-
6
-
7
-
8
-
9
-
10
-
11
-
12
-
13
-
14
-
15
-
16
-
17
-
18
-
19
-
20
-
21
-
22
-
23
-
24
-
25
-
26
-
27
-
28
-
29
-
30
-
31
-
32
-
33
-
34
-
35
-
36
-
37
-
38
-
39
-
40
-
41
-
42
-
43
-
44
-
45
-
46
-
47
-
48
-
49
-
50
-
51
-
52
-
53
-
54
-
55
-
56
-
57
-
58
-
59
-
60
-
61
-
62
-
63
-
64
-
65
-
66
-
67
-
68
-
69
-
70
-
71
-
72
-
73
-
74
-
75
-
76
-
77
-
78
-
79
-
80
-
81
-
82
-
83
-
84
-
85
-
86
-
87
-
88
-
89
-
90
-
91
-
92
-
93
-
94
-
95
-
96
-
97
-
98
-
99
-
100
-
101
-
102
-
103
-
104
-
105
-
106
-
 107
107 -
 108
108 -
 109
109 -
 110
110 -
 111
111 -
 112
112 -
 113
113 -
 114
114 -
 115
115 -
 116
116 -
 117
117 -
 118
118 -
 119
119 -
 120
120 -
 121
121 -
 122
122 -
 123
123 -
 124
124 -
 125
125 -
 126
126 -
 127
127 -
128
-
129
-
130
-
131
-
132
-
133
-
134
-
135
-
136
-
137
-
138
-
139
-
140
-
141
-
142
-
143
-
144
-
145
-
146
-
147
-
148
-
149
-
150
-
151
-
152
-
153
-
154
-
155
-
156
-
157
-
158
-
159
-
160
-
161
-
162
-
163
-
164
-
165
-
166
-
167
-
168
-
169
-
170
-
171
-
172
-
173
-
174
-
175
-
176
-
177
-
178
 |
 |

Table of Contents
NOTES TO CONSOLIDATED FINANCIAL STATEMENTS (Continued)
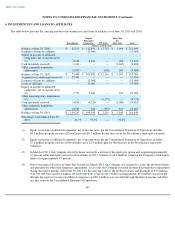
7. FAIR VALUE MEASUREMENTS (Continued)
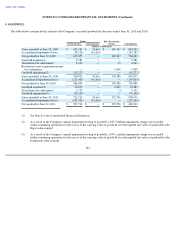
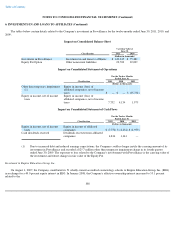
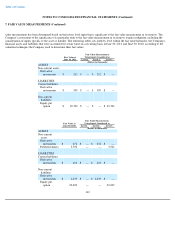
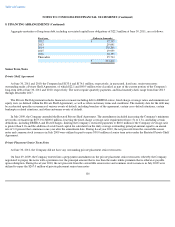
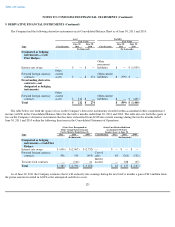
Changes in Financial Instruments Measured at Level 3 Fair Value on a Recurring Basis
The following tables present the changes during the twelve ended June 30, 2011 and 2010 in our Level 3 financial instruments that are
measured at fair value on a recurring basis.
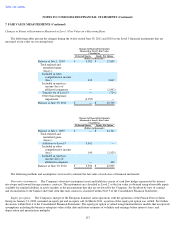
The following methods and assumptions were used to estimate the fair value of each class of financial instrument:
Derivative instruments. The Company's derivative instrument assets and liabilities consist of cash flow hedges represented by interest
rate swaps and forward foreign currency contracts. The instruments are classified as Level 2 as the fair value is obtained using observable inputs
available for similar liabilities in active markets at the measurement date that are reviewed by the Company. See breakout by type of contract
and reconciliation to the balance sheet line item that each contract is classified within Note 9 of the Consolidated Financial Statements.
Equity put option. The Company's merger of the European franchise salon operations with the operations of the Franck Provost Salon
Group on January 31, 2008 contained an equity put and an equity call. In March 2011, a portion of the equity put option was settled. See further
discussion within Note 6 to the Consolidated Financial Statements. The equity put option is valued using binomial lattice models that incorporate
assumptions including the business enterprise value at that date and future estimates of volatility and earnings before interest, taxes, and
depreciation and amortization multiples.
113
Changes in Financial Instruments
Measured at Level 3 Fair Value
Classified as
Preferred Shares
Equity Put Option
(Dollars in thousands)
Balance at July 1, 2010
$
3,502
$
22,009
Total realized and
unrealized gains
(losses):
Included in other
comprehensive income
(loss)
433
3,847
Included in equity in
income (loss) of
affiliated companies
—
(
2,442
)
Transfer out of Level 3
—
(
714
)
Other than temporary
impairment
(3,935
)
—
Balance at June 30, 2011
$
—
$
22,700
Changes in Financial Instruments
Measured at Level 3 Fair Value
Classified as
Preferred Shares Equity Put Option
(Dollars in thousands)
Balance at July 1, 2009
$
—
$
24,161
Total realized and
unrealized gains
(losses):
Additions to Level 3
3,362
—
Included in other
comprehensive income
(loss)
140
(2,620
)
Included in equity in
income (loss) of
affiliated companies
—
468
Balance at June 30, 2010
$
3,502
$
22,009