Supercuts 2011 Annual Report Download - page 44
Download and view the complete annual report
Please find page 44 of the 2011 Supercuts annual report below. You can navigate through the pages in the report by either clicking on the pages listed below, or by using the keyword search tool below to find specific information within the annual report.-
 1
1 -
2
-
3
-
4
-
5
-
6
-
7
-
8
-
9
-
10
-
11
-
12
-
13
-
14
-
15
-
16
-
17
-
18
-
19
-
20
-
21
-
22
-
23
-
24
-
25
-
26
-
27
-
28
-
29
-
30
-
31
-
32
-
33
-
 34
34 -
 35
35 -
 36
36 -
 37
37 -
 38
38 -
 39
39 -
 40
40 -
 41
41 -
 42
42 -
 43
43 -
 44
44 -
 45
45 -
 46
46 -
 47
47 -
 48
48 -
 49
49 -
 50
50 -
 51
51 -
 52
52 -
 53
53 -
 54
54 -
55
-
56
-
57
-
58
-
59
-
60
-
61
-
62
-
63
-
64
-
65
-
66
-
67
-
68
-
69
-
70
-
71
-
72
-
73
-
74
-
75
-
76
-
77
-
78
-
79
-
80
-
81
-
82
-
83
-
84
-
85
-
86
-
87
-
88
-
89
-
90
-
91
-
92
-
93
-
94
-
95
-
96
-
97
-
98
-
99
-
100
-
101
-
102
-
103
-
104
-
105
-
106
-
107
-
108
-
109
-
110
-
111
-
112
-
113
-
114
-
115
-
116
-
117
-
118
-
119
-
120
-
121
-
122
-
123
-
124
-
125
-
126
-
127
-
128
-
129
-
130
-
131
-
132
-
133
-
134
-
135
-
136
-
137
-
138
-
139
-
140
-
141
-
142
-
143
-
144
-
145
-
146
-
147
-
148
-
149
-
150
-
151
-
152
-
153
-
154
-
155
-
156
-
157
-
158
-
159
-
160
-
161
-
162
-
163
-
164
-
165
-
166
-
167
-
168
-
169
-
170
-
171
-
172
-
173
-
174
-
175
-
176
-
177
-
178
 |
 |

Table of Contents
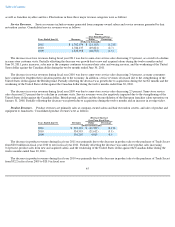
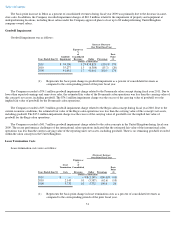
scheduled to expire on December 31, 2011. Partially offsetting the impact of the employment credits was the pre-tax non-cash
goodwill impairment charge of $74.1 million, recorded during the three months ended March 31, 2011, which is only partially
deductible for tax purposes.
RESULTS OF OPERATIONS
Beginning with the period ended December 31, 2008 the operations of Trade Secret concept within the North American reportable segment
were accounted for as discontinued operations. All periods presented will reflect Trade Secret as a discontinued operation. The following
discussion of results of operations will reflect results from continuing operations. Discontinued operations will be discussed at the end of this
section.
Consolidated Results of Operations
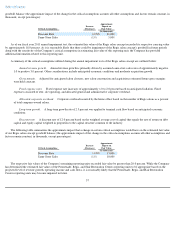
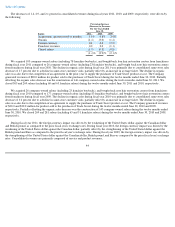
The following table sets forth, for the periods indicated, certain information derived from our Consolidated Statement of Operations in
Item 8, expressed as a percent of revenues. The percentages are computed as a percent of total revenues, except as noted.
Results of Operations as a Percent of Revenues
42
For the Years Ended
June 30,
2011 2010 2009
Service revenues
75.8
%
75.6
%
75.5
%
Product revenues
22.5
22.7
22.9
Royalties and fees
1.7
1.7
1.6
Operating expenses:
Cost of service(1)
57.5
56.9
57.0
Cost of product(2)
47.8
49.4
50.9
Site operating expenses
8.5
8.5
7.8
General and administrative
14.6
12.4
12.0
Rent
14.7
14.6
14.3
Depreciation and amortization
4.5
4.6
4.8
Goodwill impairment
3.2
1.5
1.7
Lease termination costs
—
0.1
0.2
Operating income
0.2
4.1
4.5
(Loss) income from continuing
operations before income taxes and
equity in income (loss) of affiliated
companies
(1.1
)
2.3
3.2
(Loss) income from continuing
operations
(0.4
)
1.7
0.3
Income (loss) from discontinued
operations
—
0.1
(5.4
)
Net (loss) income
(0.4
)
1.8
(5.1
)
(1) Computed as a percent of service revenues and excludes depreciation expense.
(2)
Computed as a percent of product revenues and excludes depreciation expense.