Supercuts 2011 Annual Report Download - page 46
Download and view the complete annual report
Please find page 46 of the 2011 Supercuts annual report below. You can navigate through the pages in the report by either clicking on the pages listed below, or by using the keyword search tool below to find specific information within the annual report.-
 1
1 -
2
-
3
-
4
-
5
-
6
-
7
-
8
-
9
-
10
-
11
-
12
-
13
-
14
-
15
-
16
-
17
-
18
-
19
-
20
-
21
-
22
-
23
-
24
-
25
-
26
-
27
-
28
-
29
-
30
-
31
-
32
-
33
-
34
-
35
-
 36
36 -
 37
37 -
 38
38 -
 39
39 -
 40
40 -
 41
41 -
 42
42 -
 43
43 -
 44
44 -
 45
45 -
 46
46 -
 47
47 -
 48
48 -
 49
49 -
 50
50 -
 51
51 -
 52
52 -
 53
53 -
 54
54 -
 55
55 -
 56
56 -
57
-
58
-
59
-
60
-
61
-
62
-
63
-
64
-
65
-
66
-
67
-
68
-
69
-
70
-
71
-
72
-
73
-
74
-
75
-
76
-
77
-
78
-
79
-
80
-
81
-
82
-
83
-
84
-
85
-
86
-
87
-
88
-
89
-
90
-
91
-
92
-
93
-
94
-
95
-
96
-
97
-
98
-
99
-
100
-
101
-
102
-
103
-
104
-
105
-
106
-
107
-
108
-
109
-
110
-
111
-
112
-
113
-
114
-
115
-
116
-
117
-
118
-
119
-
120
-
121
-
122
-
123
-
124
-
125
-
126
-
127
-
128
-
129
-
130
-
131
-
132
-
133
-
134
-
135
-
136
-
137
-
138
-
139
-
140
-
141
-
142
-
143
-
144
-
145
-
146
-
147
-
148
-
149
-
150
-
151
-
152
-
153
-
154
-
155
-
156
-
157
-
158
-
159
-
160
-
161
-
162
-
163
-
164
-
165
-
166
-
167
-
168
-
169
-
170
-
171
-
172
-
173
-
174
-
175
-
176
-
177
-
178
 |
 |

Table of Contents
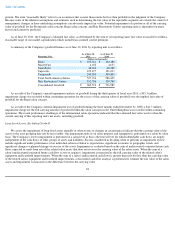
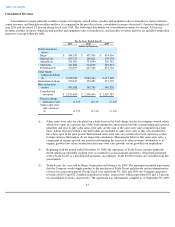
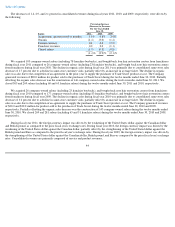
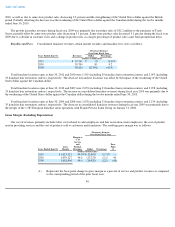
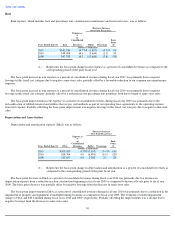
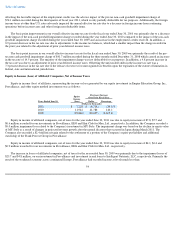
The decreases of 1.4, 2.9, and 2.1 percent in consolidated revenues during fiscal years 2011, 2010, and 2009, respectively, were driven by
the following:
We acquired 105 company-owned salons (including 78 franchise buybacks), and bought back four hair restoration centers from franchisees
during fiscal year 2011 compared to 26 company-owned salons (including 23 franchise buybacks), and bought back zero hair restoration centers
from franchisees during fiscal year 2010. The decline in organic sales during fiscal year 2011 was primarily due to consolidated same-store sales
decrease of 1.7 percent due to a decline in same-store customer visits, partially offset by an increase in average ticket. The decline in organic
sales was also due to the completion of an agreement in the prior year to supply the purchaser of Trade Secret product at cost. The Company
generated revenues of $20.0 million for product sold to the purchaser of Trade Secret during the twelve months ended June 30, 2010. Partially
offsetting the organic sales decrease was the construction of 146 company-owned salons during the twelve months ended June 30, 2011. We
closed 305 and 269 salons (including 60 and 65 franchise salons) during the twelve months ended June 30, 2011 and 2010, respectively.
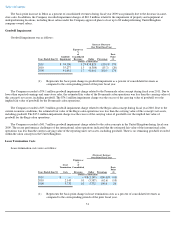
We acquired 26 company-owned salons (including 23 franchise buybacks), and bought back zero hair restoration centers from franchisees
during fiscal year 2010 compared to 177 company-
owned salons (including 83 franchise buybacks), and bought back two hair restoration centers
from franchisees during fiscal year 2009. The decline in organic sales during fiscal year 2010 was primarily due to consolidated same-store sales
decrease of 3.2 percent due to a decline in same-store customer visits, partially offset by an increase in average ticket. The decline in organic
sales was also due to the completion of an agreement to supply the purchaser of Trade Secret product at cost. The Company generated revenues
of $20.0 and $32.2 million for product sold to the purchaser of Trade Secret during the twelve months ended June 30, 2010 and 2009,
respectively. Partially offsetting the organic sales decrease was the construction of 143 company-owned salons during the twelve months ended
June 30, 2010. We closed 269 and 281 salons (including 65 and 51 franchise salons) during the twelve months ended June 30, 2010 and 2009,
respectively.
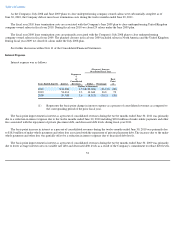
During fiscal year 2011, the foreign currency impact was driven by the weakening of the United States dollar against the Canadian dollar
and British pound, as compared to the prior fiscal year's exchange rates. During fiscal year 2010, the foreign currency impact was driven by the
weakening of the United States dollar against the Canadian dollar, partially offset by the strengthening of the United Stated dollar against the
British pound and Euro as compared to the prior fiscal year's exchange rates. During fiscal year 2009, the foreign currency impact was driven by
the strengthening of the United States dollar against the Canadian dollar, British pound, and Euro as compared to the prior fiscal year's exchange
rates. Consolidated revenues are primarily composed of service and product revenues,
44
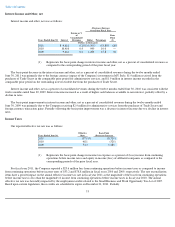
Percentage Increase
(Decrease) in Revenues
For the Years Ended
June 30,
Factor
2011
2010
2009
Acquisitions (previous twelve months)
1.1
%
0.8
%
3.4
%
Organic
(1.4
)
(3.0
)
(1.4
)
Foreign currency
0.4
0.2
(2.2
)
Franchise revenues
0.0
0.0
(1.1
)
Closed salons
(1.5
)
(0.9
)
(0.8
)
(1.4
)%
(2.9
)%
(2.1
)%