Supercuts 2011 Annual Report Download - page 47
Download and view the complete annual report
Please find page 47 of the 2011 Supercuts annual report below. You can navigate through the pages in the report by either clicking on the pages listed below, or by using the keyword search tool below to find specific information within the annual report.-
 1
1 -
2
-
3
-
4
-
5
-
6
-
7
-
8
-
9
-
10
-
11
-
12
-
13
-
14
-
15
-
16
-
17
-
18
-
19
-
20
-
21
-
22
-
23
-
24
-
25
-
26
-
27
-
28
-
29
-
30
-
31
-
32
-
33
-
34
-
35
-
36
-
 37
37 -
 38
38 -
 39
39 -
 40
40 -
 41
41 -
 42
42 -
 43
43 -
 44
44 -
 45
45 -
 46
46 -
 47
47 -
 48
48 -
 49
49 -
 50
50 -
 51
51 -
 52
52 -
 53
53 -
 54
54 -
 55
55 -
 56
56 -
 57
57 -
58
-
59
-
60
-
61
-
62
-
63
-
64
-
65
-
66
-
67
-
68
-
69
-
70
-
71
-
72
-
73
-
74
-
75
-
76
-
77
-
78
-
79
-
80
-
81
-
82
-
83
-
84
-
85
-
86
-
87
-
88
-
89
-
90
-
91
-
92
-
93
-
94
-
95
-
96
-
97
-
98
-
99
-
100
-
101
-
102
-
103
-
104
-
105
-
106
-
107
-
108
-
109
-
110
-
111
-
112
-
113
-
114
-
115
-
116
-
117
-
118
-
119
-
120
-
121
-
122
-
123
-
124
-
125
-
126
-
127
-
128
-
129
-
130
-
131
-
132
-
133
-
134
-
135
-
136
-
137
-
138
-
139
-
140
-
141
-
142
-
143
-
144
-
145
-
146
-
147
-
148
-
149
-
150
-
151
-
152
-
153
-
154
-
155
-
156
-
157
-
158
-
159
-
160
-
161
-
162
-
163
-
164
-
165
-
166
-
167
-
168
-
169
-
170
-
171
-
172
-
173
-
174
-
175
-
176
-
177
-
178
 |
 |

Table of Contents
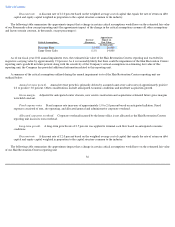
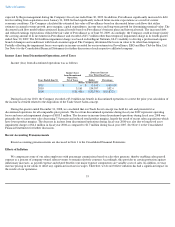
as well as franchise royalties and fees. Fluctuations in these three major revenue categories were as follows:
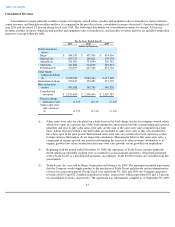
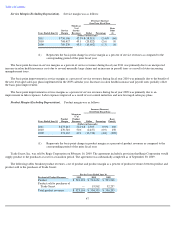
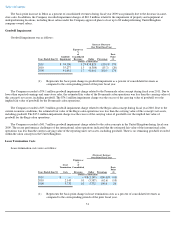
Service Revenues. Service revenues include revenues generated from company-owned salons and service revenues generated by hair
restoration centers. Consolidated service revenues were as follows:
The decrease in service revenues during fiscal year 2011 was due to same-store service sales decreasing 2.3 percent, as a result of a decline
in same-store customer visits. Partially offsetting the decrease was growth due to new and acquired salons during the twelve months ended
June 30, 2011, price increases, sales mix as the company continues to increase hair color and waxing services, and the weakening of the United
States dollar against the Canadian dollar during the twelve months ended June 30, 2011.
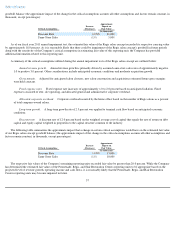
The decrease in service revenues during fiscal year 2010 was due to same-store service sales decreasing 3.4 percent, as many consumers
have continued to lengthen their visitation pattern due to the economy. In addition, service revenues decreased due to the strengthening of the
United States dollar against the British pound. Partially offsetting the decrease was growth due to acquisitions during the twelve months and the
weakening of the United States dollar against the Canadian dollar during the twelve months ended June 30, 2010.
The decrease in service revenues during fiscal year 2009 was due to same-store service sales decreasing 2.5 percent. Same-store service
sales decreased 2.5 percent due to a decline in customer visits. Service revenues were also negatively impacted due to the strengthening of the
United States dollar against the Canadian dollar, British pound, and Euro and the deconsolidation of the European franchise salon operations on
January 31, 2008. Partially offsetting the decrease was growth due to acquisitions during the twelve months and an increase in average ticket.
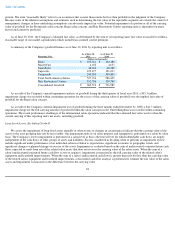
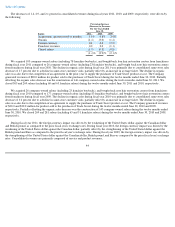
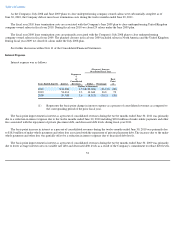
Product Revenues. Product revenues are primarily sales at company-owned salons and hair restoration centers, and sales of product and
equipment to franchisees. Consolidated product revenues were as follows:
The decrease in product revenues during fiscal year 2011 was primarily due to the decrease in product sales to the purchaser of Trade Secret
from $20.0 million in fiscal year 2010 to zero in fiscal year 2011. Partially offsetting the decrease was same-store product sales increasing
0.4 percent, product sales from new and acquired salons, and the weakening of the United States dollar against the Canadian dollar during the
twelve months ended June 30, 2011.
The decrease in product revenues during fiscal year 2010 was primarily due to the decrease in product sales to the purchaser of Trade Secret
from $32.2 in fiscal year 2009 to $20.0 in fiscal year
45
Decrease
Over Prior Fiscal Year
Years Ended June 30,
Revenues
Dollar
Percentage
(Dollars in thousands)
2011
$
1,762,974
$
(21,163
)
(1.2
)%
2010
1,784,137
(49,821
)
(2.7
)
2009
1,833,958
(28,532
)
(1.5
)
(Decrease) Increase
Over Prior Fiscal Year
Years Ended June 30,
Revenues
Dollar
Percentage
(Dollars in thousands)
2011
$
523,194
$
(11,399
)
(2.1
)%
2010
534,593
(21,612
)
(3.9
)
2009
556,205
4,919
0.9