Supercuts 2011 Annual Report Download - page 139
Download and view the complete annual report
Please find page 139 of the 2011 Supercuts annual report below. You can navigate through the pages in the report by either clicking on the pages listed below, or by using the keyword search tool below to find specific information within the annual report.-
 1
1 -
2
-
3
-
4
-
5
-
6
-
7
-
8
-
9
-
10
-
11
-
12
-
13
-
14
-
15
-
16
-
17
-
18
-
19
-
20
-
21
-
22
-
23
-
24
-
25
-
26
-
27
-
28
-
29
-
30
-
31
-
32
-
33
-
34
-
35
-
36
-
37
-
38
-
39
-
40
-
41
-
42
-
43
-
44
-
45
-
46
-
47
-
48
-
49
-
50
-
51
-
52
-
53
-
54
-
55
-
56
-
57
-
58
-
59
-
60
-
61
-
62
-
63
-
64
-
65
-
66
-
67
-
68
-
69
-
70
-
71
-
72
-
73
-
74
-
75
-
76
-
77
-
78
-
79
-
80
-
81
-
82
-
83
-
84
-
85
-
86
-
87
-
88
-
89
-
90
-
91
-
92
-
93
-
94
-
95
-
96
-
97
-
98
-
99
-
100
-
101
-
102
-
103
-
104
-
105
-
106
-
107
-
108
-
109
-
110
-
111
-
112
-
113
-
114
-
115
-
116
-
117
-
118
-
119
-
120
-
121
-
122
-
123
-
124
-
125
-
126
-
127
-
128
-
 129
129 -
 130
130 -
 131
131 -
 132
132 -
 133
133 -
 134
134 -
 135
135 -
 136
136 -
 137
137 -
 138
138 -
 139
139 -
 140
140 -
 141
141 -
 142
142 -
 143
143 -
 144
144 -
 145
145 -
 146
146 -
 147
147 -
 148
148 -
 149
149 -
150
-
151
-
152
-
153
-
154
-
155
-
156
-
157
-
158
-
159
-
160
-
161
-
162
-
163
-
164
-
165
-
166
-
167
-
168
-
169
-
170
-
171
-
172
-
173
-
174
-
175
-
176
-
177
-
178
 |
 |

Table of Contents
NOTES TO CONSOLIDATED FINANCIAL STATEMENTS (Continued)
15. SHAREHOLDERS' EQUITY (Continued)
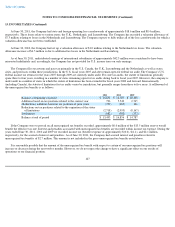
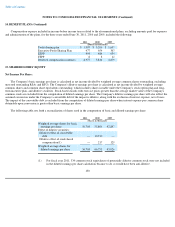
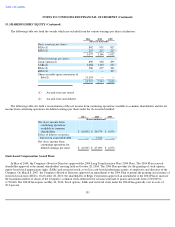
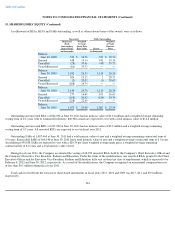
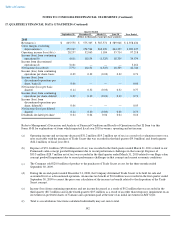
A rollforward of RSAs, RSUs and SARs outstanding, as well as other relevant terms of the awards, were as follows:
Outstanding and unvested RSAs of 862,094 at June 30, 2011 had an intrinsic value of $13.2 million and a weighted average remaining
vesting term of 2.2 years. Due to estimated forfeitures, 806,986 awards are expected to vest with a total intrinsic value of $12.4 million.
Outstanding and unvested RSUs of 215,000 at June 30, 2011 had an intrinsic value of $3.3 million and a weighted average remaining
vesting term of 0.7 years. All unvested RSUs are expected to vest in fiscal year 2012.
Outstanding SARs of 1,087,460 at June 30, 2011 had a total intrinsic value of zero and a weighted average remaining contractual term of
6.9 years. Exercisable SARs of 604,140 at June 30, 2011 had a total intrinsic value of zero and a weighted average contractual term of 6.0 years.
An additional 459,838 SARs are expected to vest with a $20.39 per share weighted average grant price, a weighted average remaining
contractual life of 8.0 years and a total intrinsic value of zero.
During fiscal year 2011, the Company accelerated the vesting of 68,390 unvested RSAs held by the Company's Chief Executive Officer and
the Company's Executive Vice President, Fashion and Education. Under the terms of the modifications, any unvested RSAs granted to the Chief
Executive Officer and the Executive Vice President, Fashion and Education fully vest on their last days of employment, which is expected to be
February 8, 2012 and June 30, 2012, respectively. As a result of the modifications, the Company recognized an incremental compensation cost
of less than $0.1 million during fiscal year 2011.
Total cash received from the exercise of share-based instruments in fiscal years 2011, 2010 and 2009 was $0.7, $3.1 and $3.9 million,
respectively.
134
Nonvested
SARs Outstanding
Restricted
Stock
Outstanding
Shares/Units
Weighted
Average
Grant Date
Fair Value
Shares
Weighted
Average
Exercise
Price
(in thousands)
(in thousands)
Balance,
June 30, 2008
523
$
36.76
527
$
35.70
Granted
618
19.14
632
19.14
Cancelled
(28
)
35.41
(45
)
35.73
Vested/Exercised
(81
)
35.72
—
—
Balance,
June 30, 2009
1,032
26.33
1,114
26.30
Granted
304
19.12
2
28.57
Cancelled
(2
)
20.02
(6
)
38.63
Vested/Exercised
(188
)
24.74
—
—
Balance,
June 30, 2010
1,146
24.70
1,110
26.24
Granted
277
16.60
103
16.60
Cancelled
(118
)
20.42
(126
)
24.35
Vested/Exercised
(228
)
22.69
—
—
Balance,
June 30, 2011
1,077
$
23.48
1,087
$
25.54