Supercuts 2011 Annual Report Download - page 66
Download and view the complete annual report
Please find page 66 of the 2011 Supercuts annual report below. You can navigate through the pages in the report by either clicking on the pages listed below, or by using the keyword search tool below to find specific information within the annual report.-
 1
1 -
2
-
3
-
4
-
5
-
6
-
7
-
8
-
9
-
10
-
11
-
12
-
13
-
14
-
15
-
16
-
17
-
18
-
19
-
20
-
21
-
22
-
23
-
24
-
25
-
26
-
27
-
28
-
29
-
30
-
31
-
32
-
33
-
34
-
35
-
36
-
37
-
38
-
39
-
40
-
41
-
42
-
43
-
44
-
45
-
46
-
47
-
48
-
49
-
50
-
51
-
52
-
53
-
54
-
55
-
 56
56 -
 57
57 -
 58
58 -
 59
59 -
 60
60 -
 61
61 -
 62
62 -
 63
63 -
 64
64 -
 65
65 -
 66
66 -
 67
67 -
 68
68 -
 69
69 -
 70
70 -
 71
71 -
 72
72 -
 73
73 -
 74
74 -
 75
75 -
 76
76 -
77
-
78
-
79
-
80
-
81
-
82
-
83
-
84
-
85
-
86
-
87
-
88
-
89
-
90
-
91
-
92
-
93
-
94
-
95
-
96
-
97
-
98
-
99
-
100
-
101
-
102
-
103
-
104
-
105
-
106
-
107
-
108
-
109
-
110
-
111
-
112
-
113
-
114
-
115
-
116
-
117
-
118
-
119
-
120
-
121
-
122
-
123
-
124
-
125
-
126
-
127
-
128
-
129
-
130
-
131
-
132
-
133
-
134
-
135
-
136
-
137
-
138
-
139
-
140
-
141
-
142
-
143
-
144
-
145
-
146
-
147
-
148
-
149
-
150
-
151
-
152
-
153
-
154
-
155
-
156
-
157
-
158
-
159
-
160
-
161
-
162
-
163
-
164
-
165
-
166
-
167
-
168
-
169
-
170
-
171
-
172
-
173
-
174
-
175
-
176
-
177
-
178
 |
 |

Table of Contents
Cash Flows
Operating Activities
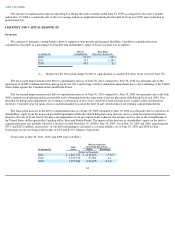
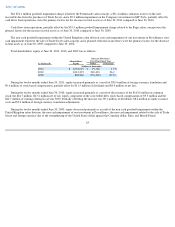
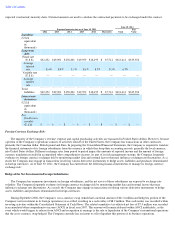
Net cash provided by operating activities during the twelve months ended June 30, 2011, 2010 and 2009 were a result of the following:
Fiscal year 2011 cash provided by operating activities was greater than fiscal year 2010 cash provided by operating activities due to an
increase of $7.6 million in dividends received from affiliated companies and a $23.9 million reduction in income tax receivables.
Fiscal year 2010 cash provided by operating activities was consistent with fiscal year 2009 cash provided by operating activities.
During fiscal year 2009, cash provided by operating activities was lower than in the twelve months ended June 30, 2008 primarily due to a
decrease in working capital cash flow, primarily related to a current year receivable from the purchaser of Trade Secret and a decrease in accrued
payroll.
64
Operating Cash Flows
For the Years Ended June 30,
2011 2010 2009
(Dollars in thousands)
Net (loss) income
$
(8,905
)
$
42,740
$
(124,466
)
Depreciation and
amortization
98,428
102,336
115,016
Equity in (income) loss of
affiliated companies
(7,228
)
(11,942
)
28,940
Dividends received from
affiliated companies
10,023
2,404
906
Deferred income taxes
(14,711
)
5,115
(3,843
)
Impairment on
discontinued operations
—
(
154
)
183,289
Goodwill and asset
impairments
80,781
41,705
51,862
Note receivable bad debt
expense
31,227
—
—
Receivables
(2,358
)
1,192
(12,104
)
Inventories
4,629
4,823
7,128
Income tax receivable
23,855
957
(34,652
)
Other current assets
4,725
2,657
(52
)
Other assets
(11,050
)
(14,951
)
(1,327
)
Accounts payable and
accrued expenses
368
1,040
(26,977
)
Other noncurrent liabilities
1,818
1,954
387
Other
17,576
12,347
3,957
$
229,178
$
192,223
$
188,064