Square Enix 2004 Annual Report Download - page 66
Download and view the complete annual report
Please find page 66 of the 2004 Square Enix annual report below. You can navigate through the pages in the report by either clicking on the pages listed below, or by using the keyword search tool below to find specific information within the annual report.-
 1
1 -
2
-
3
-
4
-
5
-
6
-
7
-
8
-
9
-
10
-
11
-
12
-
13
-
14
-
15
-
16
-
17
-
18
-
19
-
20
-
21
-
22
-
23
-
24
-
25
-
26
-
27
-
28
-
29
-
30
-
31
-
32
-
33
-
34
-
35
-
36
-
37
-
38
-
39
-
40
-
41
-
42
-
43
-
44
-
45
-
46
-
47
-
48
-
49
-
50
-
51
-
52
-
53
-
54
-
55
-
 56
56 -
 57
57 -
 58
58 -
 59
59 -
 60
60 -
 61
61 -
 62
62 -
 63
63 -
 64
64 -
 65
65 -
 66
66 -
 67
67 -
 68
68 -
 69
69 -
 70
70
 |
 |

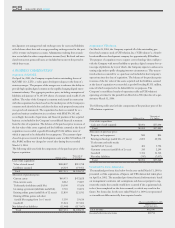
64 SQUARE ENIX 2004
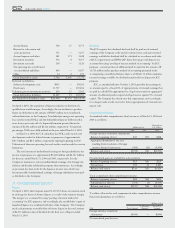
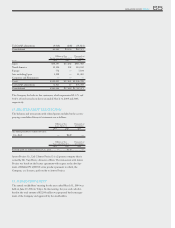
Total ¥19,398 ¥4,603 $183,536
U.S.GAAP adjustments (9,916) (208) (93,821)
Consolidated ¥9,482 ¥4,396 $89,715
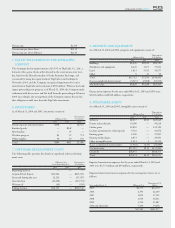
Millions of Yen Thousands of
For the years ended March 31 U.S. Dollars
Depreciation and amortization 2004 2003 2004
Games ¥870 ¥207 $8,231
Online games 742 69 7,020
Mobilephone content 17 20 160
Publication 12 8 113
Others 94 46 892
Corporate and Elimination 239 36 2,261
Total ¥1,974 ¥386 $18,677
U.S.GAAP adjustments 3,432 — 32,472
Consolidated ¥5,406 ¥386 $51,149
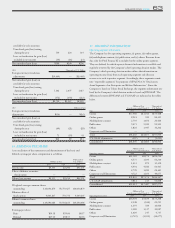
Millions of Yen Thousands of
For the years ended March 31 U.S. Dollars
Capital expenditures 2004 2003 2004
Games ¥175 ¥94 $1,655
Online games 384 59 3,633
Mobilephone content 12 25 113
Publication 0 3 11
Others — 74 —
Corporate and Elimination 1,976 46 18,696
Total ¥2,548 ¥301 $24,108
U.S.GAAP adjustments — — —
Consolidated ¥2,548 ¥301 $24,108
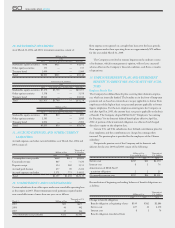
Millions of Yen Thousands of
For the years ended March 31 U.S. Dollars
Assets 2004 2003 2004
Games ¥55,104 ¥5,302 $521,373
Online games 14,215 700 134,497
Mobilephone content 2,583 580 24,439
Publication 14,225 3,094 134,591
Others 5,983 676 56,611
Corporate and Elimination 18,523 47,113 175,257
Total ¥110,633 ¥57,465 $1,046,768
U.S.GAAP adjustments 71,415 15 675,703
Consolidated ¥182,048 ¥57,480 $1,722,471
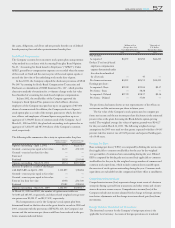
Geographic information
The Company’s chief decision maker also regularly reviewed segment
information by geographic area. Since such information is based on JPN-
GAAP, the differences between JPNGAAP and U.S.GAAP are indicated in
the tables below.
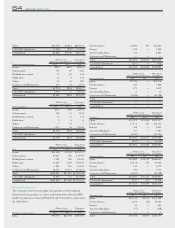
Millions of Yen Thousands of
For the years ended March 31 U.S. Dollars
Sales from external customers 2004 2003 2004
Japan ¥49,354 ¥21,368 $466,969
North America 12,981 509 122,821
Europe 148 — 1,400
Asia excluding Japan 719 — 6,804
Corporate and Elimination — — —
Total ¥63,202 ¥21,877 $597,994
U.S.GAAP adjustments (107) 6 (112)
Consolidated ¥63,095 ¥21,883 $596,981
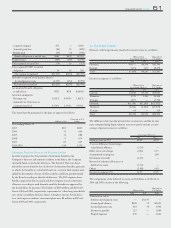
Millions of Yen Thousands of
For the years ended March 31 U.S. Dollars
Inter segment sales 2004 2003 2004
Japan ¥3,718 — $35,178
North America 389 — 3,680
Europe 279 — 2,639
Asia excluding Japan 0 — 11
Corporate and Elimination (4,386) — (41,508)
Total — — —
U.S.GAAP adjustments — — —
Consolidated — — —
Millions of Yen Thousands of
For the years ended March 31 U.S. Dollars
Total sales 2004 2003 2004
Japan ¥53,073 ¥21,368 $502,157
North America 13,371 509 126,511
Europe 428 — 4,049
Asia excluding Japan 717 — 6,783
Corporate and Elimination (4,387) — (41,506)
Total ¥63,202 ¥21,877 $597,994
U.S.GAAP adjustments (107) 6 (1,012)
Consolidated ¥63,095 ¥21,883 $596,981
Millions of Yen Thousands of
For the years ended March 31 U.S. Dollars
Operating expenses 2004 2003 2004
Japan ¥36,880 ¥16,729 $348,945
North America 10,178 545 96,300
Europe 336 — 3,179
Asia excluding Japan 796 — 7,531
Corporate and Elimination (4,387) — (41,508)
Total ¥43,803 ¥17,274 $414,447
U.S.GAAP adjustments 9,811 213 92,828
Consolidated ¥53,613 ¥17,487 $507,275
Millions of Yen Thousands of
For the years ended March 31 U.S. Dollars
Operating income 2004 2003 2004
Japan ¥16,192 ¥4,639 $153,202
North America 3,192 (36) 30,201
Europe 91 — 861
Asia excluding Japan (77) — (728)
Corporate and Elimination — — —
Total ¥19,398 ¥4,603 $183,536