Square Enix 2004 Annual Report Download - page 61
Download and view the complete annual report
Please find page 61 of the 2004 Square Enix annual report below. You can navigate through the pages in the report by either clicking on the pages listed below, or by using the keyword search tool below to find specific information within the annual report.-
 1
1 -
2
-
3
-
4
-
5
-
6
-
7
-
8
-
9
-
10
-
11
-
12
-
13
-
14
-
15
-
16
-
17
-
18
-
19
-
20
-
21
-
22
-
23
-
24
-
25
-
26
-
27
-
28
-
29
-
30
-
31
-
32
-
33
-
34
-
35
-
36
-
37
-
38
-
39
-
40
-
41
-
42
-
43
-
44
-
45
-
46
-
47
-
48
-
49
-
50
-
 51
51 -
 52
52 -
 53
53 -
 54
54 -
 55
55 -
 56
56 -
 57
57 -
 58
58 -
 59
59 -
 60
60 -
 61
61 -
 62
62 -
 63
63 -
 64
64 -
 65
65 -
 66
66 -
 67
67 -
 68
68 -
 69
69 -
 70
70
 |
 |
SQUARE ENIX 2004 59
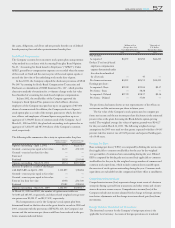
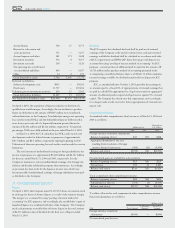
Net income ¥1,334
Net income per share-Basic ¥12.12
Net income per share-Diluted ¥11.64
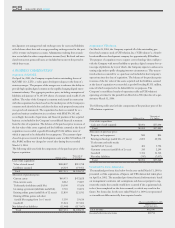
5. EQUITY INVESTMENT IN THE AFFILIATED
COMPANY
The Company had an equity interest of 26.54% in DigiCube Co., Ltd., a
domestic video game whole-seller devoted to the convenience store mar-
ket, listed on the Hercules market of Osaka Securities Exchange, and
accounted for using the equity method. DigiCube went bankrupt in
November 2003, and the Company recognized impairment loss on its
investment in DigiCube in the amount of ¥760 million. Whereas the bank-
ruptcy proceeding is in progress as of March 31, 2004, the Company made
settlement with the receiver and left itself from the proceeding in February
2004. Accordingly, the management of the Company expects that no fur-
ther obligation would arise from the DigiCube investment.
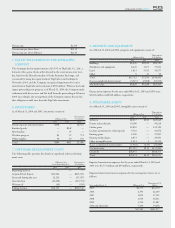
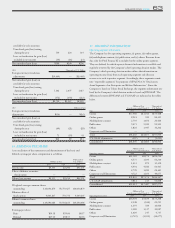
6. INVENTORIES
As of March 31, 2004 and 2003, inventories consist of:
Thousands of
Millions of Yen U.S. Dollars
2004 2003 2004
Finished goods and merchandise ¥668 — $6,325
Finished goods — ¥242 —
Merchandise — 97 —
Work in progress 81 53 774
Other supplies 60 19 561
Total ¥809 ¥411 $7,660
7. SOFTWARE DEVELOPMENT COSTS
The following table provides the details of capitalized software develop-
ment costs:
Millions of Yen Thousands of
Years Ended March 31, U.S. Dollars
2004 2003 2004
Beginning balance — — —
Acquired from Square ¥13,004 — $123,050
Increased during the year 12,226 — 115,679
Amortization (12,660) — (119,791)
Written off (63) — (598)
Ending balance ¥12,507 — $118,340
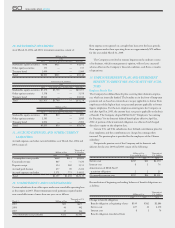
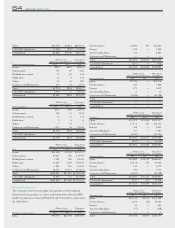
8. PROPERTY AND EQUIPMENT
As of March 31,2004 and 2003, property and equipment consist of:
Thousands of
Millions of Yen U.S. Dollars
2004 2003 2004
Buildings ¥3,445 ¥2,121 $32,595
Machinery and equipment 8,445 1,673 79,923
Land 3,813 3,392 36,077
Other 9 10 66
Total ¥15,712 ¥7,196 $148,661
(Less accumulated depreciation) (6,627) (2,008) (62,696)
Net book value ¥9,085 ¥5,188 $85,965
Depreciation expenses for the year ended March 31, 2004 and 2003 were
¥1,631 million and ¥342 million, respectively.
9. INTANGIBLE ASSETS
As of March 31, 2004 and 2003, intangible assets consist of:
Thousands of
Millions of Yen U.S. Dollars
2004 2003 2004
Software ¥2,837 ¥236 $26,846
Patent and trademark 10,380 — 98,218
Online game 12,850 — 121,582
License agreement for related goods 9,710 — 91,872
Existing game 2,940 — 27,817
Existing technologies 2,853 — 26,995
Other intangible assets 1,411 3 13,356
(Less: accumulated amortization) (5,462) (120) (51,686)
Net book value ¥37,519 ¥119 $355,000
Goodwill ¥38,955 — $368,575
Total ¥76,474 ¥119 $723,575
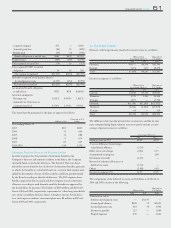
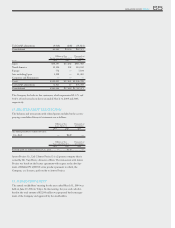
Expected amortization expenses for the years ended March 31, 2004 and
2003 were ¥3,775 million and ¥44 million, respectively.
Expected annual amortization expenses for the ensuing fiscal years are as
follows:
Thousands of U.S.
Years ending March 31, Millions of Yen Dollars
2005 ¥2,575 $24,370
2006 2,343 22,169
2007 1,851 17,522
2008 1,696 16,051
2009 1,594 15,087
2010 and thereafter 7,430 70,278
¥17,489 $165,477