Square Enix 2004 Annual Report Download - page 44
Download and view the complete annual report
Please find page 44 of the 2004 Square Enix annual report below. You can navigate through the pages in the report by either clicking on the pages listed below, or by using the keyword search tool below to find specific information within the annual report.-
 1
1 -
2
-
3
-
4
-
5
-
6
-
7
-
8
-
9
-
10
-
11
-
12
-
13
-
14
-
15
-
16
-
17
-
18
-
19
-
20
-
21
-
22
-
23
-
24
-
25
-
26
-
27
-
28
-
29
-
30
-
31
-
32
-
33
-
 34
34 -
 35
35 -
 36
36 -
 37
37 -
 38
38 -
 39
39 -
 40
40 -
 41
41 -
 42
42 -
 43
43 -
 44
44 -
 45
45 -
 46
46 -
 47
47 -
 48
48 -
 49
49 -
 50
50 -
 51
51 -
 52
52 -
 53
53 -
 54
54 -
55
-
56
-
57
-
58
-
59
-
60
-
61
-
62
-
63
-
64
-
65
-
66
-
67
-
68
-
69
-
70
 |
 |

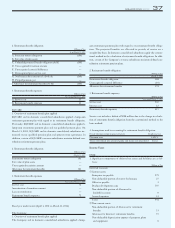
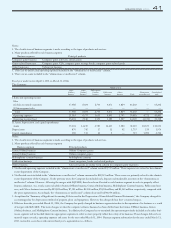
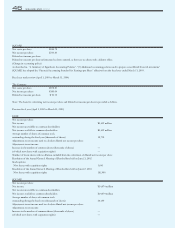
42 SQUARE ENIX 2004
Millions of Yen
Games Games Mobilephone
[Offline] [Online] Content Publication Others Eliminations Consolidated
business business business business business Total or unallocated total
Sales
(1) Sales to outside customers 11,912 942 1,656 5,920 1,445 21,877 — 21,877
(2) Intersegment sales ————————
Total 11,912 942 1,656 5,920 1,445 21,877 — 21,877
Operating expenses 8,278 1,309 872 4,582 1,197 16,240 1,033 17,274
Operating income (loss) 3,634 (366) 784 1,337 247 5,637 (1,033) 4,603
Assets, depreciation, and capital expenditures
Assets 5,302 700 580 3,094 673 10,351 47,113 57,465
Depreciation 207 69 20 8 44 349 36 386
Capital expenditures 93 59 25 2 74 255 45 301
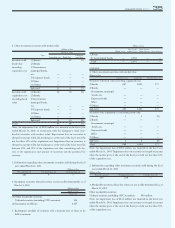
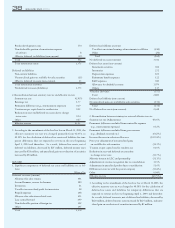
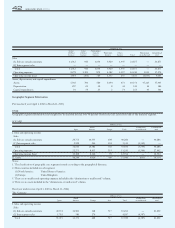
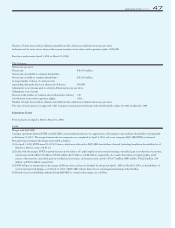
Geographic Segment Information
Previous fiscal year (April 1, 2002 to March 31, 2003)
ENIX
Geographic segment information is not required to be disclosed because over 90 percent of total sales and assets relate only to the domestic segment.
SQUARE
Millions of Yen
North Eliminations Consolidated
Japan America Europe Total or unallocated total
I. Sales and operating income
Sales
(1) Sales to outside customers 29,752 10,335 198 40,286 — 40,286
(2 ) Intersegment sales 2,908 246 394 3,549 (3,549) —
Total 32,661 10,581 592 43,836 (3,549) 40,286
Operating expenses 22,273 8,435 533 31,241 (3,549) 27,692
Operating income (loss) 10,388 2,146 59 12,594 — 12,594
II. Assets 48,244 6,024 780 55,049 (695) 54,354
Notes:
1. The classification of geographic area segments is made according to the geographical distances.
2. Main countries included in each segment:
(1) North America United States of America
(2) Europe United Kingdom
3. There are no unallocated operating expenses included in the “eliminations or unallocated” column.
4. There are no assets included in the “eliminations or unallocated” column.
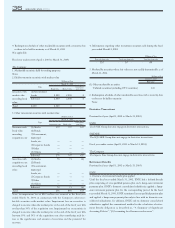
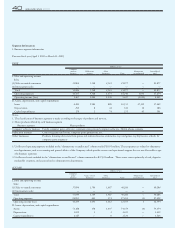
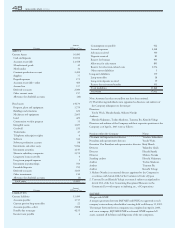
Fiscal year under review (April 1, 2003 to March 31, 2004)
The Company
Millions of Yen
North Eliminations Consolidated
Japan America Europe Asia Total or unallocated total
I. Sales and operating income
Sales
(1) Sales to outside customers 49,354 12,981 148 717 63,202 — 63,202
(2) Intersegment sales 3,718 389 279 — 4,387 (4,387) —
Total 53,073 13,371 428 717 67,589 (4,387) 63,202