Square Enix 2004 Annual Report Download - page 65
Download and view the complete annual report
Please find page 65 of the 2004 Square Enix annual report below. You can navigate through the pages in the report by either clicking on the pages listed below, or by using the keyword search tool below to find specific information within the annual report.-
 1
1 -
2
-
3
-
4
-
5
-
6
-
7
-
8
-
9
-
10
-
11
-
12
-
13
-
14
-
15
-
16
-
17
-
18
-
19
-
20
-
21
-
22
-
23
-
24
-
25
-
26
-
27
-
28
-
29
-
30
-
31
-
32
-
33
-
34
-
35
-
36
-
37
-
38
-
39
-
40
-
41
-
42
-
43
-
44
-
45
-
46
-
47
-
48
-
49
-
50
-
51
-
52
-
53
-
54
-
 55
55 -
 56
56 -
 57
57 -
 58
58 -
 59
59 -
 60
60 -
 61
61 -
 62
62 -
 63
63 -
 64
64 -
 65
65 -
 66
66 -
 67
67 -
 68
68 -
 69
69 -
 70
70
 |
 |

SQUARE ENIX 2004 63
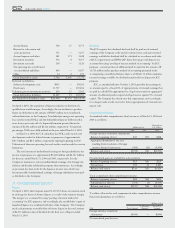
available-for-sale securities:
Unrealized gain (loss) arising
during the year 539 220 319
Less: reclassification for gain (loss)
included in net income (39) (16) (23)
Net unrealized gain (loss) ¥500 ¥204 ¥296
2004 Thousands of U.S. Dollars
Foreign currency translation
adjustments $(9,469) — $(9,460)
Net unrealized gain (loss) on
available-for-sale securities:
Unrealized gain (loss) arising
during the year 5,102 2,075 3,027
Less: reclassification for gain (loss)
included in net income (372) (150) (222)
Net unrealized gain (loss) $4,730 $1,925 $2,805
2003 Millions of Yen
Foreign currency translation
adjustments ¥(16) — ¥(16)
Net unrealized gain (loss) on
available-for-sale securities:
Unrealized gain (loss) arising
during the year (49) (21) (28)
Less: reclassification for gain (loss)
included in net income 71 (30) 41
Net unrealized gain(loss) ¥22 ¥9 ¥13
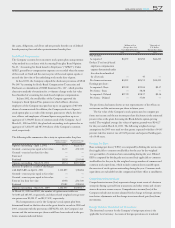
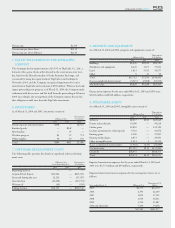
16. EARNINGS PER SHARE
A reconciliation of the numerators and denominators of the basic and
diluted earnings per share computation is as follows.
Thousands of
Millions of Yen U.S. Dollars
2004 2003 2004
Net income ¥4,355 ¥2,296 $42,205
Effect of dilutive securities:
Stock option — — —
Diluted net income ¥4,355 ¥2,296 $42,205
Weighted-average common shares
outstanding 110,030,879 58,750,427 110,030,879
Dilutive effect of:
Stock option 4,609,207 750,756 4,609,207
Diluted common shares
outstanding 114,640,086 59,501,183 114,640,086
Earnings per share:
Basic ¥39.58 ¥39.06 $0.37
Diluted ¥37.99 ¥38.57 $0.36
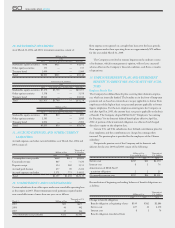
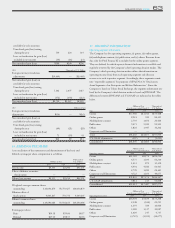
17. SEGMENT INFORMATION
Operating segment information
The Company has five operating segments; (i) games, (ii) online games,
(iii) mobilephone content, (iv) publication, and (v) others. Revenue from
disc sales for Final Fantasy XI is included in the online games segment.
They are defined for which separate financial information is available and
regularly reviewed by the Company’s chief operating decision maker. The
Company’s chief operating decision maker utilizes the information on
operating income (loss) from each operating segment and allocates
resources to each respective segment. Accordingly, these segments consti-
tute "reportable segments" for purposes of SFAS No.131 "Disclosures
about Segments of an Enterprise and Related Information". Since the
Company is listed on Tokyo Stock Exchange, the segment information uti-
lized by the Company’s chief decision maker is based on JPNGAAP. The
differences between JPNGAAP and U.S.GAAP are indicated in the tables
below.
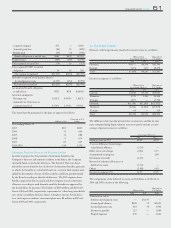
Millions of Yen Thousands of
For the years ended March 31 U.S. Dollars
Sales 2004 2003 2004
Games ¥37,988 ¥11,912 $359,428
Online games 8,924 942 84,435
Mobilephone content 2,793 1,656 26,426
Publication 9,671 5,920 91,503
Others 3,826 1,447 36,202
Corporate and Elimination — — —
Total ¥63,202 ¥21,877 $597,994
U.S.GAAP adjustments (107) 6 (1,012)
Consolidated ¥63,095 ¥21,883 $596,991
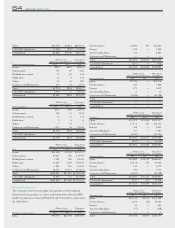
Millions of Yen Thousands of
For the years ended March 31 U.S. Dollars
Operating expenses 2004 2003 2004
Games ¥21,583 ¥8,278 $204,210
Online games 6,575 1,309 62,210
Mobilephone content 1,633 872 15,450
Publication 6,491 4,582 61,415
Others 2,799 1,200 26,465
Corporate and Elimination 4,722 1,033 44,677
Total ¥43,803 ¥17,274 $414,447
U.S.GAAP adjustments 9,811 213 92,828
Consolidated ¥53,613 ¥17,487 $507,275
Millions of Yen Thousands of
For the years ended March 31 U.S. Dollars
Operating income (loss) 2004 2003 2004
Games ¥16,404 ¥3,634 $155,208
Online games 2,348 (366) 22,215
Mobilephone content 1,159 784 10,966
Publication 3,180 1,337 30,087
Others 1,029 247 9,737
Corporate and Elimination (4,722) (1,033) (44,677)