Square Enix 2004 Annual Report Download - page 22
Download and view the complete annual report
Please find page 22 of the 2004 Square Enix annual report below. You can navigate through the pages in the report by either clicking on the pages listed below, or by using the keyword search tool below to find specific information within the annual report.-
 1
1 -
2
-
3
-
4
-
5
-
6
-
7
-
8
-
9
-
10
-
11
-
 12
12 -
 13
13 -
 14
14 -
 15
15 -
 16
16 -
 17
17 -
 18
18 -
 19
19 -
 20
20 -
 21
21 -
 22
22 -
 23
23 -
 24
24 -
 25
25 -
 26
26 -
 27
27 -
 28
28 -
 29
29 -
 30
30 -
 31
31 -
 32
32 -
33
-
34
-
35
-
36
-
37
-
38
-
39
-
40
-
41
-
42
-
43
-
44
-
45
-
46
-
47
-
48
-
49
-
50
-
51
-
52
-
53
-
54
-
55
-
56
-
57
-
58
-
59
-
60
-
61
-
62
-
63
-
64
-
65
-
66
-
67
-
68
-
69
-
70
 |
 |

20 SQUARE ENIX 2004
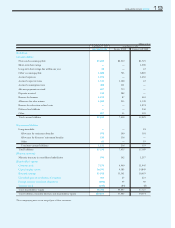
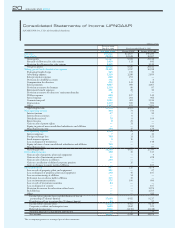
Consolidated Statements of Income (JPNGAAP)
SQUARE ENIX CO., LTD. and Consolidated Subsidiaries
(Millions of Yen)
Fiscal year ended
March 31, 2004 Fiscal year ended March 31, 2003
SQUARE ENIX Former ENIX Former SQUARE
Net sales ¥63,202 ¥21,877 ¥40,286
Cost of sales 22,084 12,368 10,967
Gross profit 41,117 9,508 29,318
Reversal of allowance for sales returns 1,420 111 842
Provision for allowance for sales returns 1,569 —1,549
Net gross profit 40,968 9,620 28,612
Selling, general and administrative expenses 21,569 5,017 16,018
Packaging freight charge 545 350 19
Advertising expense 5,119 1,288 2,850
Sales promotion expense 660 291 —
Provision for doubtful accounts 332 00
Compensation for directors 231 141 142
Salary payments 3,887 909 1,005
Provision to reserve for bonuses 1,130 80 87
Retirement benefit expenses 491 20 30
Provision to reserve for directors' retirement benefits 67—
Welfare expense 698 107 142
Rental expense 955 201 492
Commissions paid 3,023 401 3,536
Depreciation 1,179 385 690
Other 3,307 831 7,020
Operating income 19,398 4,603 12,594
Non-operating income 440 73 556
Interest income 67 090
Interest from securities —0—
Dividends received 78 0104
Rental income 023 —
Gain on sale of patent rights —31 —
Equity in gains of non-consolidated subsidiaries and affiliates ——182
Miscellaneous income 294 17 179
Non-operating expenses 1,590 24 390
Interest expenses 7230
Foreign exchange loss 788 11 122
Stock issuance expense 810 —
Loss on disposal of inventories ——148
Equity in losses of non-consolidated subsidiaries and affiliates 760 ——
Miscellaneous loss 25 —87
Recurring profits 18,248 4,652 12,760
Extraordinary income 300 15 335
Gain on sale of property, plant and equipment ——4
Gain on sale of investment securities 59 —228
Gain on sale of shares in affiliates 240 ——
Gain on cancellation of defined corporate pension —15 —
Gain on changes in equity method affiliates ——103
Extraordinary loss 907 215 3,878
Loss on sale of property, plant and equipment 123 —67
Loss on disposal of property, plant and equipment 198 45 107
Loss on restructuring at affiliates —54 —
Evaluation loss on shares held in affiliates 125 15 —
Loss on investment securities 375 100 606
Loss on sale of investment securities 84 ——
Loss on disposal of content ——107
Provision for reserve for relocation-related costs ——1,074
Bad-debt loss ——1,503
Other ——412
Income before income taxes and distribution of loss in
partnership (Tokumei-kumiai) 17,640 4,452 9,217
Distribution of loss in partnership (Tokumei-kumiai) 24 —97
Income before income taxes 17,616 4,452 9,119
Corporate, resident and enterprise taxes 3,600 3,162 521
Deferred income taxes 2,962 (1,156) (6,248)
Minority interest in consolidated subsidiaries 59 27 770
Net income 10,993 2,419 14,074
The accompanying notes are an integral part of these statements.