Square Enix 2004 Annual Report Download - page 45
Download and view the complete annual report
Please find page 45 of the 2004 Square Enix annual report below. You can navigate through the pages in the report by either clicking on the pages listed below, or by using the keyword search tool below to find specific information within the annual report.-
 1
1 -
2
-
3
-
4
-
5
-
6
-
7
-
8
-
9
-
10
-
11
-
12
-
13
-
14
-
15
-
16
-
17
-
18
-
19
-
20
-
21
-
22
-
23
-
24
-
25
-
26
-
27
-
28
-
29
-
30
-
31
-
32
-
33
-
34
-
 35
35 -
 36
36 -
 37
37 -
 38
38 -
 39
39 -
 40
40 -
 41
41 -
 42
42 -
 43
43 -
 44
44 -
 45
45 -
 46
46 -
 47
47 -
 48
48 -
 49
49 -
 50
50 -
 51
51 -
 52
52 -
 53
53 -
 54
54 -
 55
55 -
56
-
57
-
58
-
59
-
60
-
61
-
62
-
63
-
64
-
65
-
66
-
67
-
68
-
69
-
70
 |
 |

SQUARE ENIX 2004 43
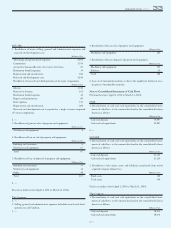
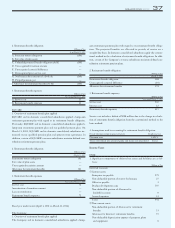
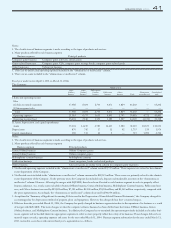
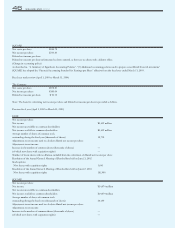
Operating expenses 36,880 10,178 336 796 48,191 (4,387) 43,803
Operating income (loss) 16,192 3,192 91 (79) 19,398 — 19,398
II. Assets 96,547 12,106 772 1,207 110,633 — 110,633
Notes:
1. The classification of geographic area segments is made according to the geographical distances.
2. Main countries included in each segment:
(1) North America United States of America
(2) Europe United Kingdom
(3) Asia China
3. There are no unallocated operating expenses included in the “eliminations or unallocated” column.
4. There are no assets included in the “eliminations or unallocated” column.
5. As explained in “Summary of Significant Accounting Policies used in the Preparation of Consolidated Financial Statements,” the Company changed its
accounting policy for depreciation method of property, plant and equipment. However, this change did not have a material impact.
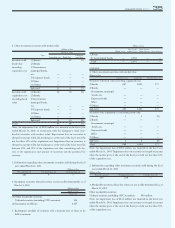
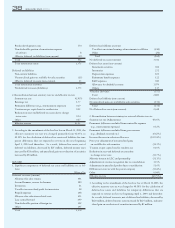
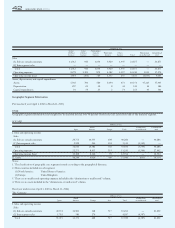
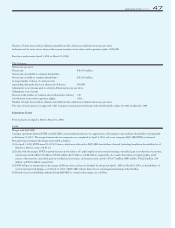
Overseas Sales
Previous fiscal year (April 1, 2002 to March 31, 2003)
ENIX
As total overseas sales constituted less than 10% of consolidated net sales, information relating to overseas sales has been omitted.
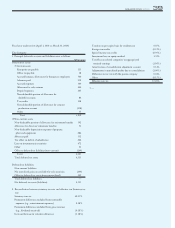
SQUARE
Millions of Yen
North America Europe Others Total
I. Overseas sales 11,587 2,695 142 14,425
II. Consolidated sales ———40,286
III. Percentage of overseas sales to consolidated sales (%) 28.8 6.7 0.3 35.8
Notes:
1. The classification of geographic area segments is made according to the geographical distances.
2. Main countries included in each segment:
(1) North America United States of America, Canada
(2) Europe United Kingdom, France, Germany, etc.
(3) Others Asia, etc.
3. Overseas sales represent sales of the Company and its consolidated subsidiaries to countries and areas outside of Japan.
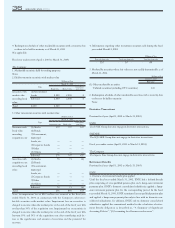
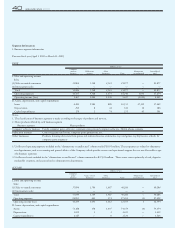
Fiscal year under review (April 1, 2003 to March 31, 2004)
The Company
Millions of Yen
North America Europe Asia Total
I. Overseas sales 15,618 2,121 972 18,712
II. Consolidated sales ———63,202
III. Percentage of overseas sales to consolidated sales (%) 24.7 3.4 1.5 29.6
Notes:
1. The classification of geographic area segments is made according to the geographical distances.
2. Main countries included in each segment:
(1) North America United States of America, Canada
(2) Europe United Kingdom, France, Germany, etc.
(3) Asia China, etc.
3. Overseas sales represent sales of the Company and its consolidated subsidiaries to countries and areas outside of Japan.