Square Enix 2004 Annual Report Download - page 25
Download and view the complete annual report
Please find page 25 of the 2004 Square Enix annual report below. You can navigate through the pages in the report by either clicking on the pages listed below, or by using the keyword search tool below to find specific information within the annual report.-
 1
1 -
2
-
3
-
4
-
5
-
6
-
7
-
8
-
9
-
10
-
11
-
12
-
13
-
14
-
 15
15 -
 16
16 -
 17
17 -
 18
18 -
 19
19 -
 20
20 -
 21
21 -
 22
22 -
 23
23 -
 24
24 -
 25
25 -
 26
26 -
 27
27 -
 28
28 -
 29
29 -
 30
30 -
 31
31 -
 32
32 -
 33
33 -
 34
34 -
 35
35 -
36
-
37
-
38
-
39
-
40
-
41
-
42
-
43
-
44
-
45
-
46
-
47
-
48
-
49
-
50
-
51
-
52
-
53
-
54
-
55
-
56
-
57
-
58
-
59
-
60
-
61
-
62
-
63
-
64
-
65
-
66
-
67
-
68
-
69
-
70
 |
 |
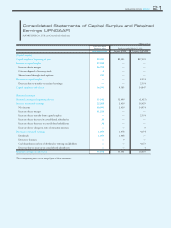
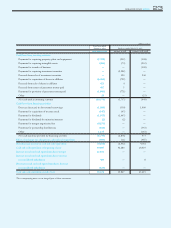
SQUARE ENIX 2004 23
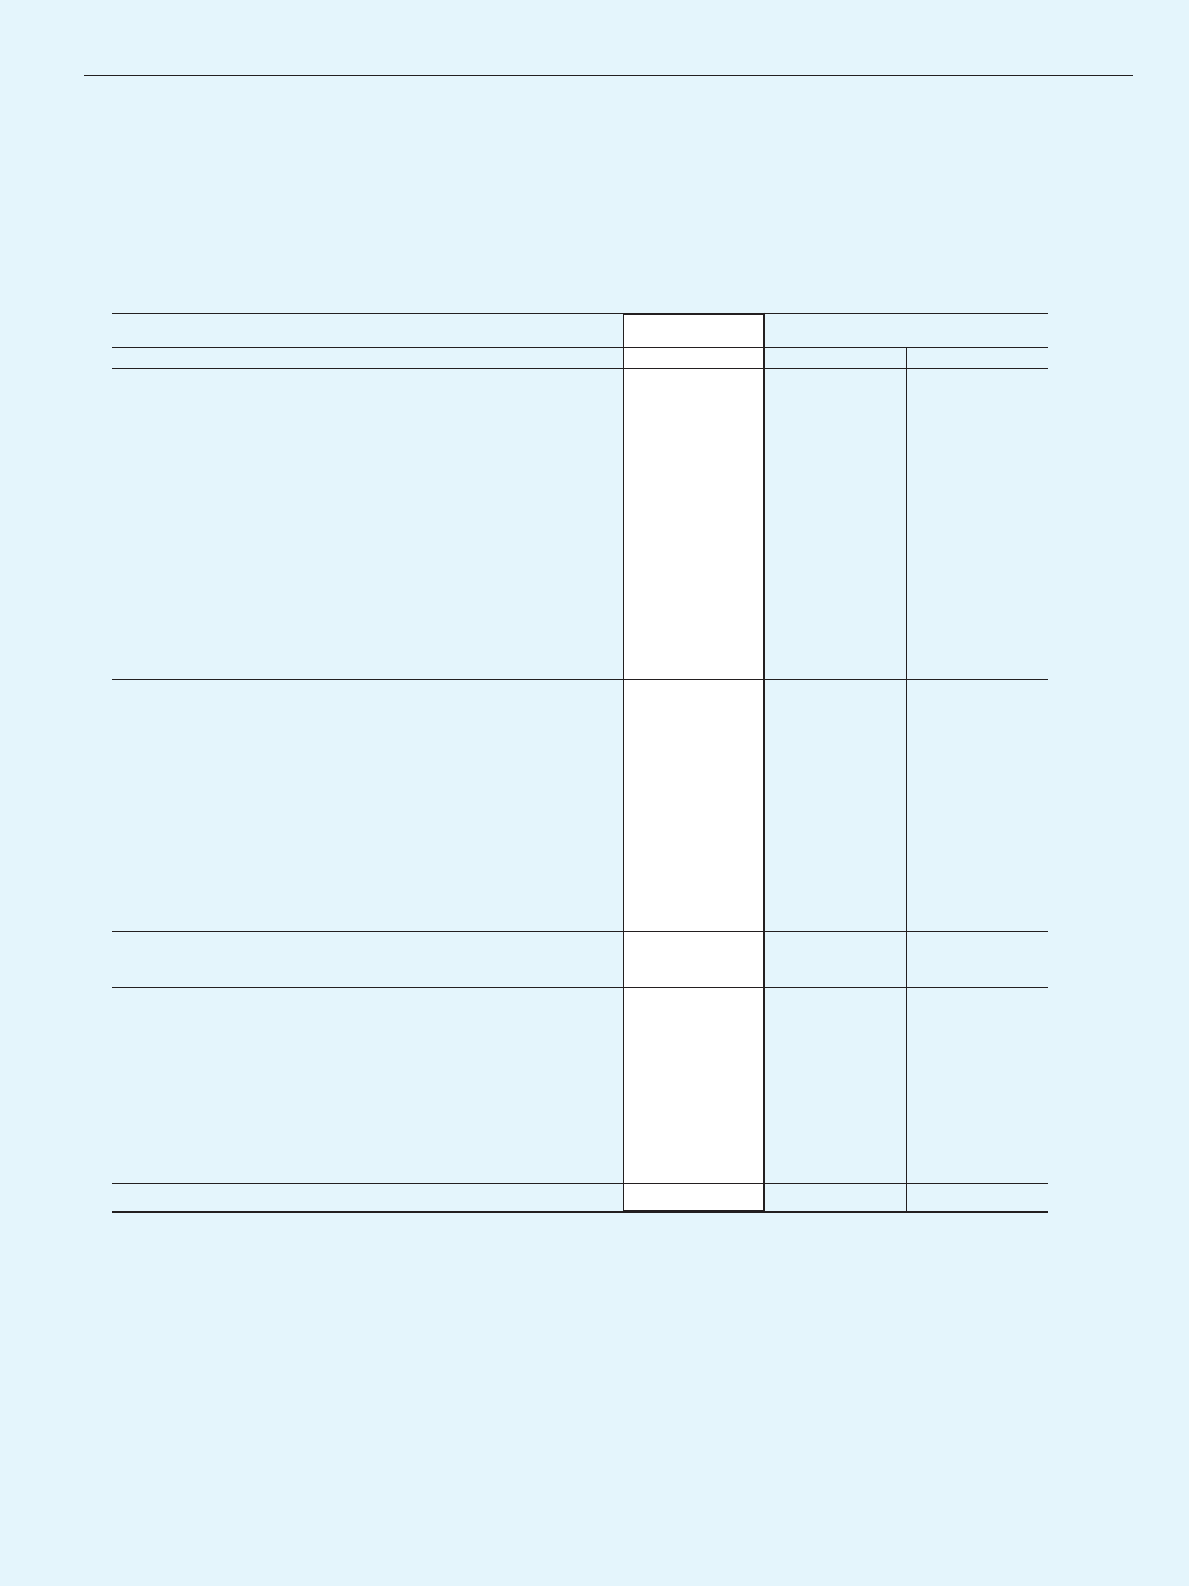
(Millions of Yen)
Fiscal year ended
March 31, 2004 Fiscal year ended March 31, 2003
SQUARE ENIX Former ENIX Former SQUARE
Cash flows from investing activities
Payments for acquiring property, plant and equipment (2,709) (215) (368)
Payments for acquiring intangible assets (416) (79) (232)
Payments for transfer of business ——(300)
Payments for acquiring investment securities —(2,002) —
Proceeds from sales of investment securities —120 246
Payments for acquisition of shares in affiliates (6,461) (795) —
Proceeds from sale of shares in affiliates 423 4—
Proceeds from return of guarantee money paid 407 3—
Payments for provision of guarantee money paid (1,843) (771) —
Other 20 —(25)
Net cash used in investing activities (10,579) (3,737) (649)
Cash flows from financing activities
Decrease (increase) in short-term borrowings (1,000) (359) 1,000
Payments for acquisition of treasury stock (147) (47) —
Payments for dividends (1,955) (1,467) —
Payments for dividends for minority interests (2) (2) —
Payments for merger negotiation fees (4,153) ——
Payments for partnership distributions (616) —(363)
Other 1,135 —(163)
Net cash (used in) provided by financing activities (6,739) (1,876) 473
Effect of exchange rate changes on cash and cash equivalents (984) (11) (487)
Net (decrease) increase in cash and cash equivalents (4,164) (2,432) 4,581
Cash and cash equivalents at beginning of year 39,847 42,280 18,629
Increase in cash and cash equivalents due to merger 22,632 ——
Increase in cash and cash equivalents due to increase
in consolidated subsidiaries 484 —8
Decrease in cash and cash equivalents due to decrease
in consolidated subsidiaries (123) ——
Cash and cash equivalents at end of year 58,676 39,847 23,219
The accompanying notes are an integral part of these statements.