Square Enix 2004 Annual Report Download - page 42
Download and view the complete annual report
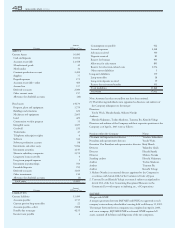
Please find page 42 of the 2004 Square Enix annual report below. You can navigate through the pages in the report by either clicking on the pages listed below, or by using the keyword search tool below to find specific information within the annual report.-
 1
1 -
2
-
3
-
4
-
5
-
6
-
7
-
8
-
9
-
10
-
11
-
12
-
13
-
14
-
15
-
16
-
17
-
18
-
19
-
20
-
21
-
22
-
23
-
24
-
25
-
26
-
27
-
28
-
29
-
30
-
31
-
 32
32 -
 33
33 -
 34
34 -
 35
35 -
 36
36 -
 37
37 -
 38
38 -
 39
39 -
 40
40 -
 41
41 -
 42
42 -
 43
43 -
 44
44 -
 45
45 -
 46
46 -
 47
47 -
 48
48 -
 49
49 -
 50
50 -
 51
51 -
 52
52 -
53
-
54
-
55
-
56
-
57
-
58
-
59
-
60
-
61
-
62
-
63
-
64
-
65
-
66
-
67
-
68
-
69
-
70
 |
 |

40 SQUARE ENIX 2004
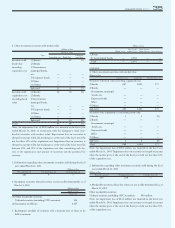
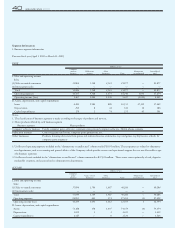
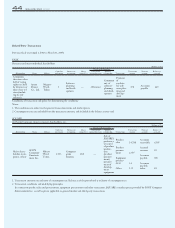
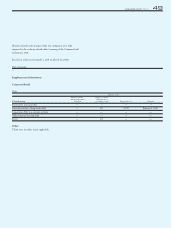
Segment Information
1. Business segment information
Previous fiscal year (April 1, 2002 to March 31, 2003)
ENIX
Millions of Yen
Computer
software Publication Other Eliminations Consolidated
business business businesses Total or unallocated total
I. Sales and operating income
Sales
(1) Sales to outside customers 13,804 5,548 2,523 21,877 — 21,877
(2) Intersegment sales — — — — — —
Total 13,804 5,548 2,523 21,877 — 21,877
Operating expenses 10,337 4,528 1,373 16,240 1,033 17,274
Operating income (loss) 3,467 1,020 1,149 5,637 (1,033) 4,603
II. Assets, depreciation, and capital expenditures
Assets 6,490 2,984 880 10,355 47,109 57,465
Depreciation 296 8 44 349 36 386
Capital expenditures 178 2 74 255 45 301
Notes:
1. The classification of business segments is made according to the types of products and services.
2. Major products offered by each business segment
Business segment Major products
Computer software business Family computer game softwares, communication personal computer softwares, Mobile phone contents
Publication business Comic magazines and books, computer game guidebooks, etc.
Other businesses Products featuring characters from games and animated movies, stationeries, toys and games, royalty income, schools for
computer game engineers
3. Unallocated operating expenses included in the “eliminations or unallocated” column totaled ¥1,033 million. These expenses are related to administra-
tive departments, such as accounting and general affairs, of the Company, which provide services and operational support that are not allocatable to spe-
cific business segments.
4. Unallocated assets included in the “eliminations or unallocated” column amounted to ¥47,109 million. These assets consist primarily of cash, deposits,
marketable securities, and assets related to administrative departments.
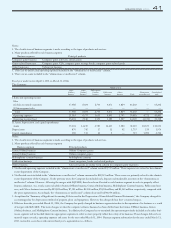
SQUARE
Millions of Yen
Computer
game Game-related Other Eliminations Consolidated
business businesses businesses Total or unallocated total
I. Sales and operating income
Sales
(1) Sales to outside customers 37,094 1,704 1,487 40,286 — 40,286
(2) Intersegment sales — — — — — —
Total 37,094 1,704 1,487 40,286 — 40,286
Operating expenses 26,855 663 174 27,693 (1) 27,692
Operating income (loss) 10,239 1,041 1,312 12,593 1 12,594
II. Assets, depreciation, and capital expenditures
Assets 53,188 158 1,007 54,354 (0) 54,354
Depreciation 1,632 1 1 1,635 — 1,635
Capital expenditures 1,325 — 0 1,326 — 1,326