Square Enix 2004 Annual Report Download - page 24
Download and view the complete annual report
Please find page 24 of the 2004 Square Enix annual report below. You can navigate through the pages in the report by either clicking on the pages listed below, or by using the keyword search tool below to find specific information within the annual report.-
 1
1 -
2
-
3
-
4
-
5
-
6
-
7
-
8
-
9
-
10
-
11
-
12
-
13
-
 14
14 -
 15
15 -
 16
16 -
 17
17 -
 18
18 -
 19
19 -
 20
20 -
 21
21 -
 22
22 -
 23
23 -
 24
24 -
 25
25 -
 26
26 -
 27
27 -
 28
28 -
 29
29 -
 30
30 -
 31
31 -
 32
32 -
 33
33 -
 34
34 -
35
-
36
-
37
-
38
-
39
-
40
-
41
-
42
-
43
-
44
-
45
-
46
-
47
-
48
-
49
-
50
-
51
-
52
-
53
-
54
-
55
-
56
-
57
-
58
-
59
-
60
-
61
-
62
-
63
-
64
-
65
-
66
-
67
-
68
-
69
-
70
 |
 |
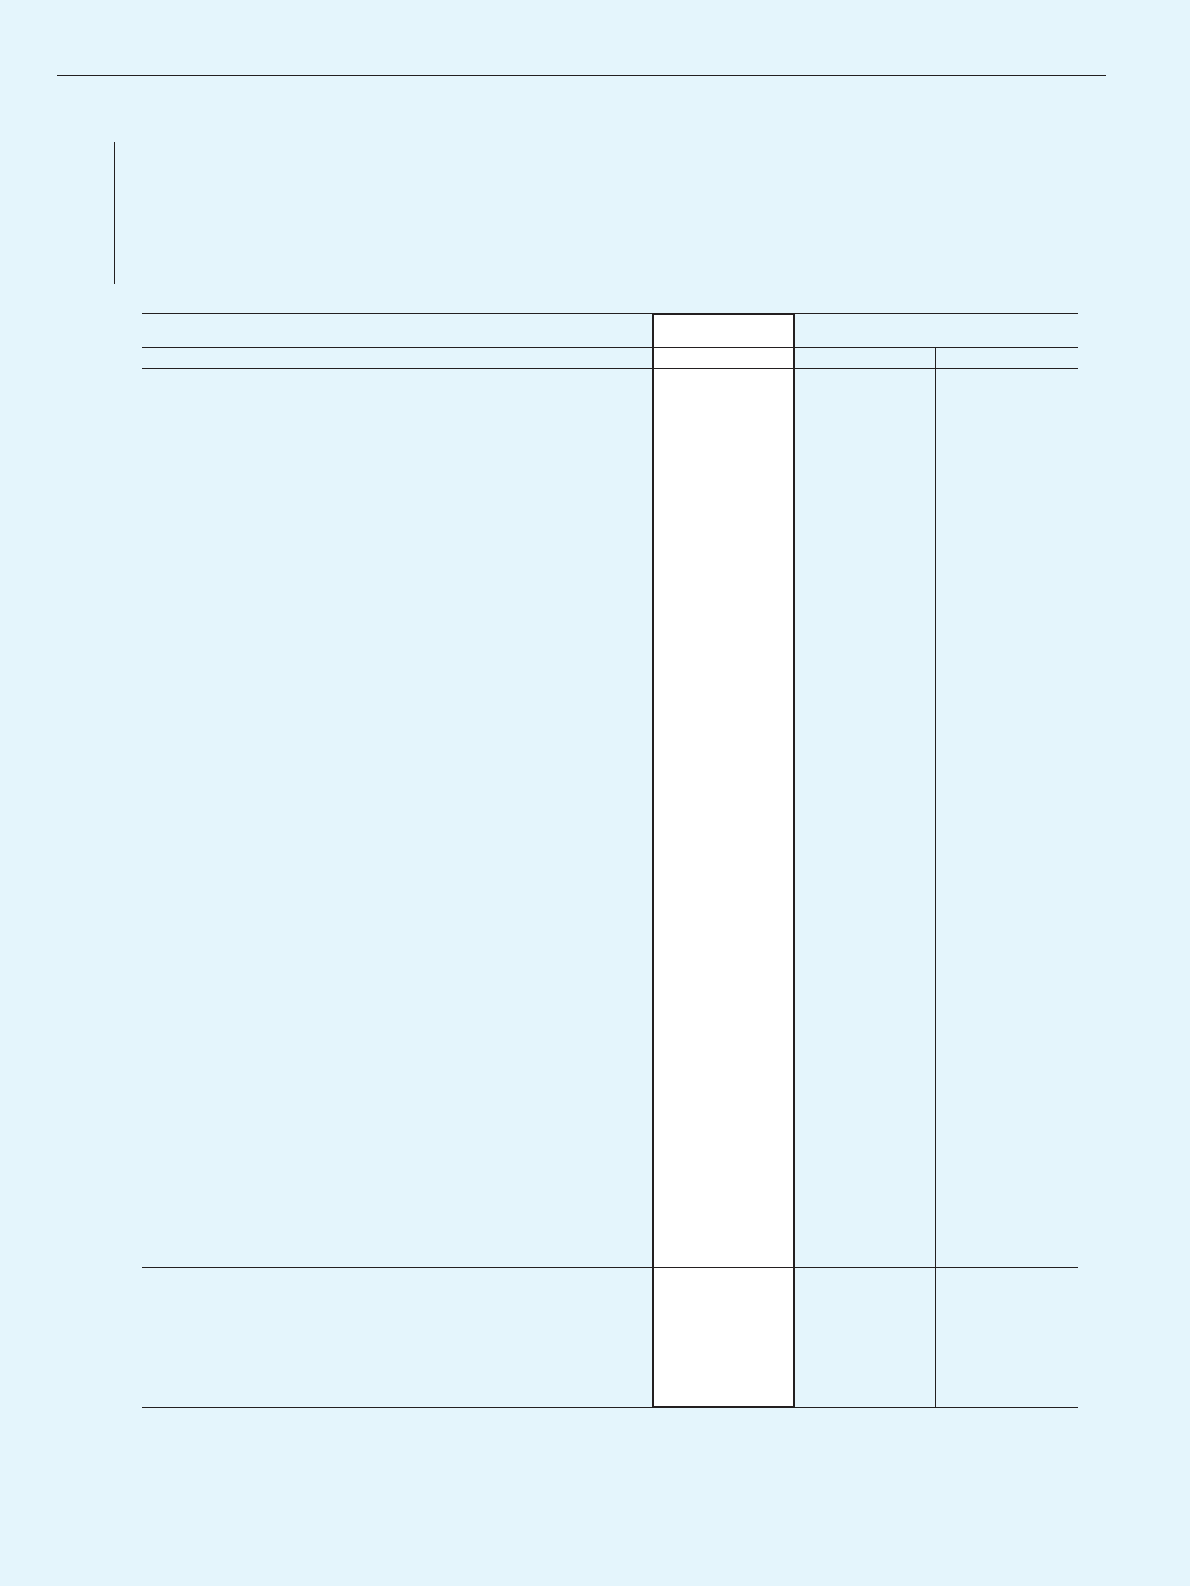
22 SQUARE ENIX 2004
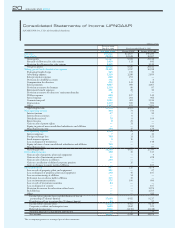
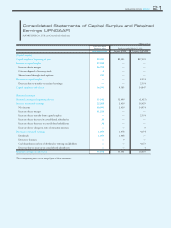
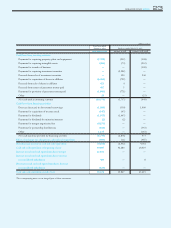
Consolidated Statements of Cash Flows (JPNGAAP)
SQUARE ENIX CO., LTD. and Consolidated Subsidiaries
(Millions of Yen)
Fiscal year ended
March 31, 2004 Fiscal year ended March 31, 2003
SQUARE ENIX Former ENIX Former SQUARE
Cash flows from operating activities
Income before income taxes ¥17,616 4,452 9,119
Depreciation 1,974 386 1,685
Increase (decrease) in allowance for doubtful receivables 224 (14) 0
Increase (decrease) in reserve for bonuses 688 (32) 154
(Decrease) in allowance for sales returns (105) (111) (127)
Increase (decrease) in allowance for retirement benefits 576 (4) 155
(Decrease) increase in allowance for directors' retirement benefits (26) 7(92)
(Decrease) increase in reserve for relocation-related costs (589) —1,074
Loss from bad debt ——1,503
Interest and dividend received (145) —(194)
Interest income —(0) —
Dividends received —(0) —
Interest from securities —(0) —
Interest expenses 7230
Loss on restructuring of affiliates —54 —
Gain on sale of investment securities (59) —(228)
Loss on sale of investment securities 84 ——
Losses on investments in securities 375 100 606
Gain on sale of shares held in affiliates (240) ——
Evaluation loss on shares held in affiliates 125 15 —
Loss on disposal of property and equipment 198 45 107
Loss on sales of property and equipment 123 —63
Decrease (increase) in accounts receivable 4,852 (46) (7,296)
(Increase) decrease in inventories (6,745) 154 (2,764)
(Decrease) increase in purchase liabilities (507) 681 764
(Decrease) increase in accrued consumption taxes (104) 45 —
Decrease in other current assets 250 9—
Decrease (increase) in other fixed assets 299 (470) —
(Decrease) increase in other current liabilities (2,014) 374 —
Payment of directors' bonuses —(9) —
Other 1,958 —321
Subtotal 18,818 5,639 4,884
Interest and dividends received 126 2392
Interest paid (11) (2) (8)
Income taxes paid (4,794) (2,446) (22)
Net cash provided by operating activities 14,139 3,192 5,245