Square Enix 2004 Annual Report Download - page 43
Download and view the complete annual report
Please find page 43 of the 2004 Square Enix annual report below. You can navigate through the pages in the report by either clicking on the pages listed below, or by using the keyword search tool below to find specific information within the annual report.-
 1
1 -
2
-
3
-
4
-
5
-
6
-
7
-
8
-
9
-
10
-
11
-
12
-
13
-
14
-
15
-
16
-
17
-
18
-
19
-
20
-
21
-
22
-
23
-
24
-
25
-
26
-
27
-
28
-
29
-
30
-
31
-
32
-
 33
33 -
 34
34 -
 35
35 -
 36
36 -
 37
37 -
 38
38 -
 39
39 -
 40
40 -
 41
41 -
 42
42 -
 43
43 -
 44
44 -
 45
45 -
 46
46 -
 47
47 -
 48
48 -
 49
49 -
 50
50 -
 51
51 -
 52
52 -
 53
53 -
54
-
55
-
56
-
57
-
58
-
59
-
60
-
61
-
62
-
63
-
64
-
65
-
66
-
67
-
68
-
69
-
70
 |
 |

SQUARE ENIX 2004 41
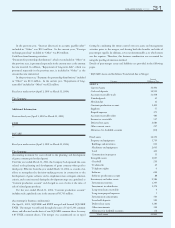
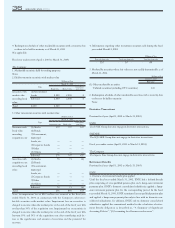
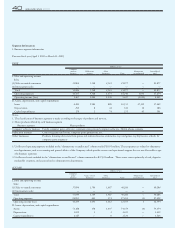
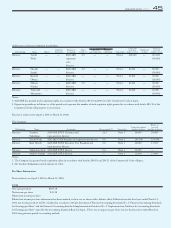
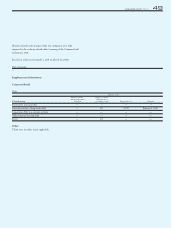
Notes:
1. The classification of business segments is made according to the types of products and services.
2. Major products offered by each business segment
Business segment Principal products
Computer game business Computer game softwares, online games
Game-related businesses Computer game CDs, computer game strategy books, computer game-related goods
Other businesses Videogram business
3. There are no unallocated operating expenses included in the “eliminations or unallocated” column.
4. There are no assets included in the “eliminations or unallocated” column.
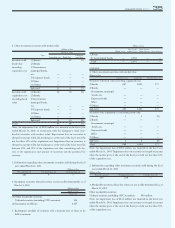
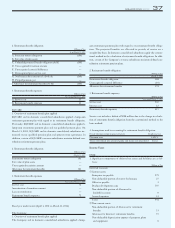
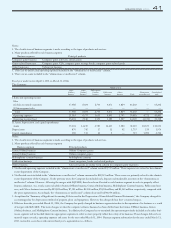
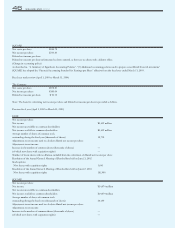
Fiscal year under review (April 1, 2003 to March 31, 2004)
The Company
Millions of Yen
Game Game Mobilephone
[Offline] [Online] Content Publication Others Eliminations Consolidated
business business business business business Total or unallocated total
I. Sales and operating income
Sales
(1) Sales to outside customers 37,988 8,924 2,793 9,671 3,824 63,202 — 63,202
(2) Intersegment sales ————————
Total 37,988 8,924 2,793 9,671 3,824 63,202 — 63,202
Operating expenses 21,583 6,575 1,633 6,491 2,797 39,081 4,722 43,803
Operating income (loss) 16,404 2,348 1,159 3,180 1,027 24,120 (4,722) 19,398
II. Assets, depreciation, and capital expenditures
Assets 55,104 14,215 2,583 14,225 5,980 92,110 18,523 110,633
Depreciation 870 742 17 12 92 1,735 239 1,974
Capital expenditures 188 513 12 0 — 715 1,989 2,704
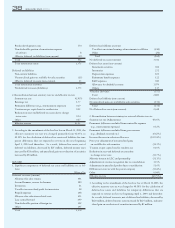
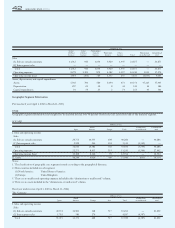
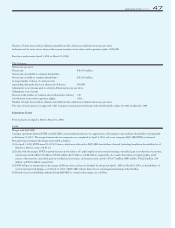
Notes:
1. The classification of business segments is made according to the types of products and services.
2. Major products offered by each business segment
Business segment Principal products
Game [Offline] business Offline Computer games
Game [Online] business Online computer games
Mobilephone Content business Mobilephone contents
Publication business Comic magazines, books, and related products
Others business Character goods secondary work, schools for computer game engineers
3. Unallocated operating expenses included in the “eliminations or unallocated” column totaled ¥4,722 million. These expenses are related to the adminis-
trative department of the Company.
4. Unallocated assets included in the “eliminations or unallocated” column amounted to ¥18,523 million. These assets are primarily related to the adminis-
trative department of the Company. In the previous years, the Company has included cash, deposits and marketable securities in the “eliminations or
unallocated” column. However, following the merger with SQUARE, these have been allocated to each business segment in order to properly reflect
business substance. As a result, assets included in Games (Offline) business, Games (Online) business, Mobilephone Content business, Publication busi-
ness, and Others business increased by ¥23,829 million, ¥7,582 million, ¥2,166 million, ¥9,206 million, and ¥3,249 million, respectively, compared with
the prior segmentation. Accordingly, the “eliminations or unallocated” column decreased by ¥46,034 million.
5. As explained in “Summary of Significant Accounting Policies used in the Preparation of Consolidated Financial Statements,” the Company changed its
accounting policy for depreciation method of property, plant and equipment. However, this change did not have a material impact.
6. Effective from the year ended March 31, 2004, the Company has partly changed its business segmentation due to the expantion of its business as a result
of merger with SQUARE. The main changes are that the computer software business has been divided into the Games (Offline) business, Games
(Online) business, and Mobilephone Content business. In addition, the Company has re-examined the operations previously included in the other busi-
nesses segment and reclassified them into appropriate segments in order to more properly reflect the reality of its business. These changes did not have
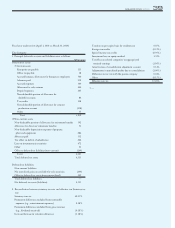
material impact on sales, operating expenses and assets for the year ended March 31, 2004. Business segment information for the year ended March 31,
2003, restated in accordance with current fiscal year’s segmentation is as follows: