Shutterfly 2014 Annual Report Download - page 80
Download and view the complete annual report
Please find page 80 of the 2014 Shutterfly annual report below. You can navigate through the pages in the report by either clicking on the pages listed below, or by using the keyword search tool below to find specific information within the annual report.-
 1
1 -
2
-
3
-
4
-
5
-
6
-
7
-
8
-
9
-
10
-
11
-
12
-
13
-
14
-
15
-
16
-
17
-
18
-
19
-
20
-
21
-
22
-
23
-
24
-
25
-
26
-
27
-
28
-
29
-
30
-
31
-
32
-
33
-
34
-
35
-
36
-
37
-
38
-
39
-
40
-
41
-
42
-
43
-
44
-
45
-
46
-
47
-
48
-
49
-
50
-
51
-
52
-
53
-
54
-
55
-
56
-
57
-
58
-
59
-
60
-
61
-
62
-
63
-
64
-
65
-
66
-
67
-
68
-
69
-
 70
70 -
 71
71 -
 72
72 -
 73
73 -
 74
74 -
 75
75 -
 76
76 -
 77
77 -
 78
78 -
 79
79 -
 80
80 -
 81
81 -
 82
82 -
 83
83 -
 84
84 -
 85
85 -
 86
86 -
 87
87 -
 88
88 -
 89
89 -
 90
90 -
91
-
92
-
93
-
94
-
95
-
96
-
97
-
98
-
99
-
100
-
101
-
102
-
103
-
104
-
105
-
106
-
107
-
108
-
109
-
110
-
111
-
112
-
113
-
114
-
115
-
116
-
117
-
118
-
119
-
120
-
121
-
122
-
123
-
124
-
125
-
126
-
127
-
128
-
129
-
130
 |
 |
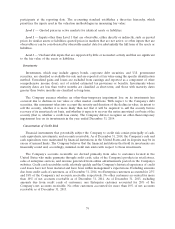
participants at the reporting date. The accounting standard establishes a three-tier hierarchy, which
prioritizes the inputs used in the valuation methodologies in measuring fair value:
Level 1 — Quoted prices in active markets for identical assets or liabilities.
Level 2 — Inputs other than Level 1 that are observable, either directly or indirectly, such as quoted
prices for similar assets or liabilities; quoted prices in markets that are not active; or other inputs that are
observable or can be corroborated by observable market data for substantially the full term of the assets or
liabilities.
Level 3 — Unobservable inputs that are supported by little or no market activity and that are significant
to the fair value of the assets or liabilities.
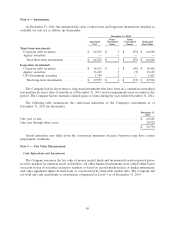
Investments
Investments, which may include agency bonds, corporate debt securities, and U.S. government
securities, are classified as available-for-sale and are reported at fair value using the specific identification
method. Unrealized gains and losses are excluded from earnings and reported as a component of other
comprehensive income (loss), net of related estimated tax provisions or benefits. Investments whose
maturity dates are less than twelve months are classified as short-term, and those with maturity dates
greater than twelve months are classified as long-term.
The Company assesses whether an other-than-temporary impairment loss on its investments has
occurred due to declines in fair value or other market conditions. With respect to the Company’s debt
securities, this assessment takes into account the severity and duration of the decline in value, its intent to
sell the security, whether it is more likely than not that it will be required to sell the security before
recovery of its amortized cost basis, and whether it expects to recover the entire amortized cost basis of the
security (that is, whether a credit loss exists). The Company did not recognize an other-than-temporary
impairment loss on its investments in the year ended December 31, 2014.
Concentration of Credit Risk
Financial instruments that potentially subject the Company to credit risk consist principally of cash,
cash equivalents, investments, and accounts receivable. As of December 31, 2014, the Company’s cash and
cash equivalents were maintained by financial institutions in the United States and its deposits may be in
excess of insured limits. The Company believes that the financial institutions that hold its investments are
financially sound and, accordingly, minimal credit risk exists with respect to these investments.
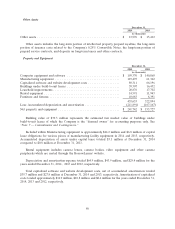
The Company’s accounts receivable are derived primarily from sales to customers located in the
United States who make payments through credit cards, sales of the Company’s products in retail stores,
sales of enterprise services, and revenue generated from online advertisements posted on the Company’s
websites. Credit card receivables settle relatively quickly and the Company’s historical experience of credit
card losses have not been material and have been within management’s expectations. Excluding amounts
due from credit cards of customers, as of December 31, 2014, two Enterprise customers accounted for 25%
and 18% of the Company’s net accounts receivable, respectively. No other customers accounted for more
than 10% of net accounts receivable as of December 31, 2014. As of December 31, 2013, excluding
amounts due from credit cards of customers, one Enterprise customer accounted for 28% of the
Company’s net accounts receivable. No other customers accounted for more than 10% of net accounts
receivable as of December 31, 2013.
79