Shutterfly 2014 Annual Report Download - page 64
Download and view the complete annual report
Please find page 64 of the 2014 Shutterfly annual report below. You can navigate through the pages in the report by either clicking on the pages listed below, or by using the keyword search tool below to find specific information within the annual report.-
 1
1 -
2
-
3
-
4
-
5
-
6
-
7
-
8
-
9
-
10
-
11
-
12
-
13
-
14
-
15
-
16
-
17
-
18
-
19
-
20
-
21
-
22
-
23
-
24
-
25
-
26
-
27
-
28
-
29
-
30
-
31
-
32
-
33
-
34
-
35
-
36
-
37
-
38
-
39
-
40
-
41
-
42
-
43
-
44
-
45
-
46
-
47
-
48
-
49
-
50
-
51
-
52
-
53
-
 54
54 -
 55
55 -
 56
56 -
 57
57 -
 58
58 -
 59
59 -
 60
60 -
 61
61 -
 62
62 -
 63
63 -
 64
64 -
 65
65 -
 66
66 -
 67
67 -
 68
68 -
 69
69 -
 70
70 -
 71
71 -
 72
72 -
 73
73 -
 74
74 -
75
-
76
-
77
-
78
-
79
-
80
-
81
-
82
-
83
-
84
-
85
-
86
-
87
-
88
-
89
-
90
-
91
-
92
-
93
-
94
-
95
-
96
-
97
-
98
-
99
-
100
-
101
-
102
-
103
-
104
-
105
-
106
-
107
-
108
-
109
-
110
-
111
-
112
-
113
-
114
-
115
-
116
-
117
-
118
-
119
-
120
-
121
-
122
-
123
-
124
-
125
-
126
-
127
-
128
-
129
-
130
 |
 |

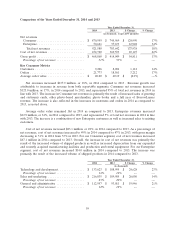
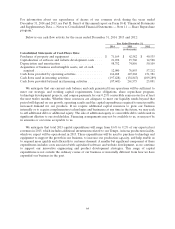
Our general and administrative expense increased $22.5 million, or 32%, in 2013 compared to 2012. As
a percentage of net revenues, general and administrative expense increased to 12% in 2013 from 11% in
2012. The increase in general and administrative expense is primarily due to an increase in stock-based
compensation of $6.4 million as a result of increased headcount and an increase in depreciation and
amortization of $4.5 million. There was also an increase in personnel related costs of $3.9 million, an
increase in credit card fees of $3.3 million which was driven by the increase in Consumer net revenues as
compared to the prior year, an increase in facility costs of $1.5 million, and an increase in professional fees
of $1.5 million, offset by a reduction in the gains on disposition of assets of $0.9 million in 2013.
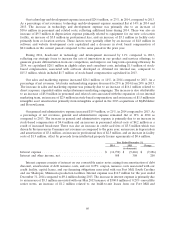
Year Ended December 31,
2013 2012 Change
(in thousands)
Interest expense .................................. $ (9,446) $ (597) $ (8,849)
Interest and other income, net ........................ 308 42 266
Interest expense consists of interest on our convertible senior notes arising from amortization of debt
discount, amortization of debt issuance costs, and our 0.25% coupon, issuance costs associated with our
credit facility; capital leases and our financing obligation associated with our Fort Mill, South Carolina
production facility. Interest expense was $9.4 million for the year ended December 31, 2013 compared to
$0.6 million during 2012. The increase is primarily due to $8.2 million of interest expense associated with
our May 2013 issuance of $300.0 million of 0.25% convertible senior notes.
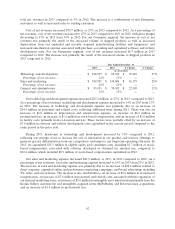
Year Ended December 31,
2013 2012
(in thousands)
Income tax provision ......................................... $ (3,635) $ (17,160)
Effective tax rate ........................................... 28% 43%
The provision for income taxes was $3.6 million for 2013, compared to a provision of $17.2 million for
2012. Our effective tax rate was 28% in 2013 and 43% in 2012. The decrease in our effective tax rate was
primarily the result of higher disqualifying dispositions of incentive stock option awards and the enactment
during 2013 of the federal research credit for fiscal 2013 and 2012, offset by non-deductible executive
compensation.
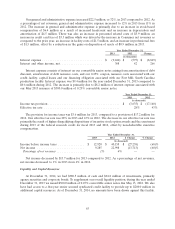
Year Ended December 31,
2013 2012 $ Change % Change
(in thousands)
Income before income taxes ............... $ 12,920 $ 40,158 $ (27,238) (68)%
Net income ........................... 9,285 22,998 (13,713) (60)%
Percentage of net revenues ................ 1% 4% ——
Net income decreased by $13.7 million for 2013 compared to 2012. As a percentage of net revenues,
net income decreased to 1% in 2013 from 4% in 2012.
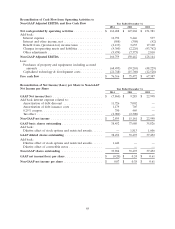
Liquidity and Capital Resources
At December 31, 2014, we had $380.5 million of cash and $94.8 million of investments, primarily
agency securities and corporate bonds. To supplement our overall liquidity position, during the year ended
December 31, 2013 we issued $300.0 million of 0.25% convertible senior notes due May 15, 2018. We also
have had access to a five-year senior secured syndicated credit facility to provide up to $200.0 million in
additional capital resources. As of December 31, 2014, no amounts have been drawn against this facility.
63