Shutterfly 2014 Annual Report Download - page 69
Download and view the complete annual report
Please find page 69 of the 2014 Shutterfly annual report below. You can navigate through the pages in the report by either clicking on the pages listed below, or by using the keyword search tool below to find specific information within the annual report.-
 1
1 -
2
-
3
-
4
-
5
-
6
-
7
-
8
-
9
-
10
-
11
-
12
-
13
-
14
-
15
-
16
-
17
-
18
-
19
-
20
-
21
-
22
-
23
-
24
-
25
-
26
-
27
-
28
-
29
-
30
-
31
-
32
-
33
-
34
-
35
-
36
-
37
-
38
-
39
-
40
-
41
-
42
-
43
-
44
-
45
-
46
-
47
-
48
-
49
-
50
-
51
-
52
-
53
-
54
-
55
-
56
-
57
-
58
-
 59
59 -
 60
60 -
 61
61 -
 62
62 -
 63
63 -
 64
64 -
 65
65 -
 66
66 -
 67
67 -
 68
68 -
 69
69 -
 70
70 -
 71
71 -
 72
72 -
 73
73 -
 74
74 -
 75
75 -
 76
76 -
 77
77 -
 78
78 -
 79
79 -
80
-
81
-
82
-
83
-
84
-
85
-
86
-
87
-
88
-
89
-
90
-
91
-
92
-
93
-
94
-
95
-
96
-
97
-
98
-
99
-
100
-
101
-
102
-
103
-
104
-
105
-
106
-
107
-
108
-
109
-
110
-
111
-
112
-
113
-
114
-
115
-
116
-
117
-
118
-
119
-
120
-
121
-
122
-
123
-
124
-
125
-
126
-
127
-
128
-
129
-
130
 |
 |

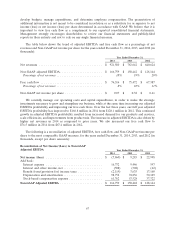
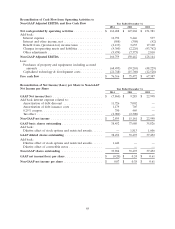
Reconciliation of Cash Flow from Operating Activities to
Non-GAAP Adjusted EBITDA and Free Cash Flow Year Ended December 31,
2014 2013 2012
Net cash provided by operating activities ................ $ 166,488 $ 147,268 $ 151,381
Add back:
Interest expense ................................ 16,732 9,446 597
Interest and other income, net ...................... (508) (308) (42)
Benefit from /(provision for) income taxes ............. (2,119) 3,635 17,160
Changes in operating assets and liabilities .............. (4,360) (2,226) (43,762)
Other adjustments ............................... (9,474) (7,373) 2,810
Non-GAAP Adjusted EBITDA ........................ 166,759 150,442 128,144
Less:
Purchases of property and equipment, including accrued
amounts .................................... (68,495) (59,210) (48,229)
Capitalized technology & development costs ............ (21,748) (15,760) (12,528)
Free cash flow ................................... $ 76,516 $ 75,472 $ 67,387
Reconciliation of Net Income/(Loss) per Share to Non-GAAP
Net Income per Share Year Ended December 31,
2014 2013 2012
GAAP Net income/(loss) ............................ $ (7,860) $ 9,285 $ 22,998
Add back interest expense related to:
Amortization of debt discount ...................... 11,726 7,002 —
Amortization of debt issuance costs .................. 1,179 705 —
0.25% coupon .................................. 750 469 —
Tax effect ..................................... (2,900) (2,300) —
Non-GAAP net income ............................. $ 2,895 $ 15,161 $ 22,998
GAAP basic shares outstanding ....................... 38,452 37,680 35,826
Add back:
Dilutive effect of stock options and restricted awards ...... — 1,813 1,606
GAAP diluted shares outstanding ..................... 38,452 39,493 37,432
Add back:
Dilutive effect of stock options and restricted awards ...... 1,442 — —
Dilutive effect of convertible notes ...................———
Non-GAAP shares outstanding ....................... 39,894 39,493 37,432
GAAP net income/(loss) per share ..................... $ (0.20) $ 0.24 $ 0.61
Non-GAAP net income per share ...................... $ 0.07 $ 0.38 $ 0.61
68