Shutterfly 2014 Annual Report Download - page 63
Download and view the complete annual report
Please find page 63 of the 2014 Shutterfly annual report below. You can navigate through the pages in the report by either clicking on the pages listed below, or by using the keyword search tool below to find specific information within the annual report.-
 1
1 -
2
-
3
-
4
-
5
-
6
-
7
-
8
-
9
-
10
-
11
-
12
-
13
-
14
-
15
-
16
-
17
-
18
-
19
-
20
-
21
-
22
-
23
-
24
-
25
-
26
-
27
-
28
-
29
-
30
-
31
-
32
-
33
-
34
-
35
-
36
-
37
-
38
-
39
-
40
-
41
-
42
-
43
-
44
-
45
-
46
-
47
-
48
-
49
-
50
-
51
-
52
-
 53
53 -
 54
54 -
 55
55 -
 56
56 -
 57
57 -
 58
58 -
 59
59 -
 60
60 -
 61
61 -
 62
62 -
 63
63 -
 64
64 -
 65
65 -
 66
66 -
 67
67 -
 68
68 -
 69
69 -
 70
70 -
 71
71 -
 72
72 -
 73
73 -
74
-
75
-
76
-
77
-
78
-
79
-
80
-
81
-
82
-
83
-
84
-
85
-
86
-
87
-
88
-
89
-
90
-
91
-
92
-
93
-
94
-
95
-
96
-
97
-
98
-
99
-
100
-
101
-
102
-
103
-
104
-
105
-
106
-
107
-
108
-
109
-
110
-
111
-
112
-
113
-
114
-
115
-
116
-
117
-
118
-
119
-
120
-
121
-
122
-
123
-
124
-
125
-
126
-
127
-
128
-
129
-
130
 |
 |

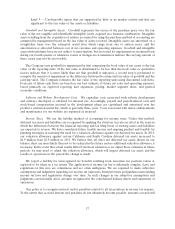
total net revenues in 2013 compared to 4% in 2012. The increase is a combination of new Enterprise
customers as well as increased sales to existing customers.
Cost of net revenues increased $74.7 million, or 25%, in 2013 compared to 2012. As a percentage of
net revenues, cost of net revenues increased to 47% in 2013 compared to 46% in 2012, with gross margin
decreasing to 53% in 2013 from 54% in 2012. For our Consumer segment, the increase in cost of net
revenues was primarily the result of the increased volume of shipped products as well as increased
depreciation from our expanded and recently acquired manufacturing facilities and equipment, and
increased amortization expense associated with purchase accounting and capitalized software and website
development costs. For our Enterprise segment, cost of net revenues increased $6.7 million in 2013
compared to 2012. The increase was primarily the result of the increased volume of shipped products in
2013 compared to 2012.
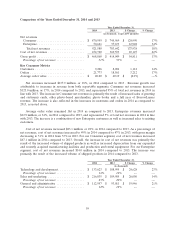
Year Ended December 31,
2013 2012 $ Change % Change
(in thousands)
Technology and development ............... $ 108,995 $ 85,746 $ 23,249 27%
Percentage of net revenues ................ 14% 13% ——
Sales and marketing ..................... $ 189,985 $ 148,806 $ 41,179 28%
Percentage of net revenues ................ 24% 23% ——
General and administrative ................ $ 93,011 $ 70,502 $ 22,509 32%
Percentage of net revenues ................ 12% 11% ——
Our technology and development expense increased $23.2 million, or 27%, in 2013, compared to 2012.
As a percentage of net revenues, technology and development expense increased to 14% in 2013 from 13%
in 2012. The increase in technology and development expense was primarily due to an increase of
$14.4 million in personnel and related costs, reflecting additional hires during 2013. There was also an
increase of $6.0 million in depreciation and amortization expense, an increase of $2.6 million in
professional fees, an increase of $1.6 million in stock-based compensation, and an increase of $1.0 million
in facility costs primarily from co-location services. These factors were partially offset by an increase of
$3.0 million in software and website development costs capitalized in the current period compared to the
same period in the prior year.
During 2013, headcount in technology and development increased by 31% compared to 2012,
reflecting our strategic focus to increase the rate of innovation in our product and services offerings, to
generate greater differentiation from our competitors, and improve our long-term operating efficiency. In
2013, we capitalized $15.3 million in eligible salary and consultant costs, including $1.7 million of stock-
based compensation, associated with software developed or obtained for internal use, compared to
$12.4 million, which included $0.9 million of stock-based compensation capitalized in 2012.
Our sales and marketing expense increased $41.2 million, or 28%, in 2013 compared to 2012. As a
percentage of net revenues, total sales and marketing expense increased to 24% in 2013 from 23% in 2012.
The increase in sales and marketing expense was primarily due to an increase of $20.2 million related to
direct response, expanded online and performance marketing campaigns, and brand advertising, including
TV, radio, and out-of-home. The increase is also attributable to an increase of $8.2 million in stock-based
compensation, an increase of $7.6 million in personnel and related costs associated with the expansion of
our internal marketing team, an increase of $3.6 million in intangible asset amortization primarily from the
Kodak Gallery customer list and intangibles acquired in the MyPublisher and BorrowLenses acquisitions,
and an increase of $1.4 million in professional fees.
62