Shutterfly 2014 Annual Report Download - page 101
Download and view the complete annual report
Please find page 101 of the 2014 Shutterfly annual report below. You can navigate through the pages in the report by either clicking on the pages listed below, or by using the keyword search tool below to find specific information within the annual report.-
 1
1 -
2
-
3
-
4
-
5
-
6
-
7
-
8
-
9
-
10
-
11
-
12
-
13
-
14
-
15
-
16
-
17
-
18
-
19
-
20
-
21
-
22
-
23
-
24
-
25
-
26
-
27
-
28
-
29
-
30
-
31
-
32
-
33
-
34
-
35
-
36
-
37
-
38
-
39
-
40
-
41
-
42
-
43
-
44
-
45
-
46
-
47
-
48
-
49
-
50
-
51
-
52
-
53
-
54
-
55
-
56
-
57
-
58
-
59
-
60
-
61
-
62
-
63
-
64
-
65
-
66
-
67
-
68
-
69
-
70
-
71
-
72
-
73
-
74
-
75
-
76
-
77
-
78
-
79
-
80
-
81
-
82
-
83
-
84
-
85
-
86
-
87
-
88
-
89
-
90
-
 91
91 -
 92
92 -
 93
93 -
 94
94 -
 95
95 -
 96
96 -
 97
97 -
 98
98 -
 99
99 -
 100
100 -
 101
101 -
 102
102 -
 103
103 -
 104
104 -
 105
105 -
 106
106 -
 107
107 -
 108
108 -
 109
109 -
 110
110 -
 111
111 -
112
-
113
-
114
-
115
-
116
-
117
-
118
-
119
-
120
-
121
-
122
-
123
-
124
-
125
-
126
-
127
-
128
-
129
-
130
 |
 |

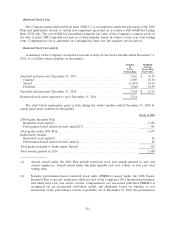
Stock Option Activity
A summary of the Company’s stock option activity at December 31, 2014 and changes during the
period are presented in the table below (share numbers and aggregate intrinsic values in thousands):
Weighted
Weighted Average
Number of Average Contractual Aggregate
Options Exercise Term Intrinsic
Outstanding Price (Years) Value
Balances, December 31, 2013 .............. 616 $ 23.10
Granted ............................ — —
Exercised ........................... (190) 17.09
Forfeited, canceled or expired ............ (24) 31.84
Balances, December 31, 2014 .............. 402 $ 25.42 4.5 $ 7,200
Options vested and expected to vest at
December 31, 2014 .................... 399 $ 25.39 4.5 $ 7,169
Options vested at December 31, 2014 ........ 356 $ 24.36 4.1 $ 6,746
As of December 31, 2013 and 2012, there were 462,000 and 1,677,000 options vested, respectively.
During the year ended December 31, 2014, the Company did not grant any stock options. In the fiscal
years ended December 31, 2013 and 2012, the Company granted stock options to purchase an aggregate of
2,000 and 139,000 shares of common stock, respectively, with a weighted average grant-date fair value of
$12.55 and $12.93 per share, respectively.
The total intrinsic value of options exercised during the twelve months ended December 31, 2014, 2013
and 2012 was $6.1 million, $41.5 million and $12.3 million, respectively. Net cash proceeds from the
exercise of stock options were $3.2 million for the twelve months ended December 31, 2014.
Valuation of Stock Options
The Company estimated the fair value of each option award on the date of grant using the Black-
Scholes option-pricing model and the assumptions noted in the following table. The Company calculated
volatility using an average of its historical and implied volatilities as it had sufficient public trading history
to cover the entire expected term. The expected term of options gave consideration to historical exercises,
post vest cancellations and the options contractual term. The risk-free rate for the expected term of the
option is based on the U.S. Treasury Constant Maturity at the time of grant. The assumptions used to value
options granted during 2013 and 2012 were as follows:
Year Ended December 31,
2013 2012
Dividend yield ............................................. — —
Annual risk free rate of return ................................. 0.8% 0.8%
Expected volatility .......................................... 47.0% 56.5%
Expected term (years) ........................................ 4.2 4.3
100