Shutterfly 2014 Annual Report Download - page 68
Download and view the complete annual report
Please find page 68 of the 2014 Shutterfly annual report below. You can navigate through the pages in the report by either clicking on the pages listed below, or by using the keyword search tool below to find specific information within the annual report.-
 1
1 -
2
-
3
-
4
-
5
-
6
-
7
-
8
-
9
-
10
-
11
-
12
-
13
-
14
-
15
-
16
-
17
-
18
-
19
-
20
-
21
-
22
-
23
-
24
-
25
-
26
-
27
-
28
-
29
-
30
-
31
-
32
-
33
-
34
-
35
-
36
-
37
-
38
-
39
-
40
-
41
-
42
-
43
-
44
-
45
-
46
-
47
-
48
-
49
-
50
-
51
-
52
-
53
-
54
-
55
-
56
-
57
-
 58
58 -
 59
59 -
 60
60 -
 61
61 -
 62
62 -
 63
63 -
 64
64 -
 65
65 -
 66
66 -
 67
67 -
 68
68 -
 69
69 -
 70
70 -
 71
71 -
 72
72 -
 73
73 -
 74
74 -
 75
75 -
 76
76 -
 77
77 -
 78
78 -
79
-
80
-
81
-
82
-
83
-
84
-
85
-
86
-
87
-
88
-
89
-
90
-
91
-
92
-
93
-
94
-
95
-
96
-
97
-
98
-
99
-
100
-
101
-
102
-
103
-
104
-
105
-
106
-
107
-
108
-
109
-
110
-
111
-
112
-
113
-
114
-
115
-
116
-
117
-
118
-
119
-
120
-
121
-
122
-
123
-
124
-
125
-
126
-
127
-
128
-
129
-
130
 |
 |

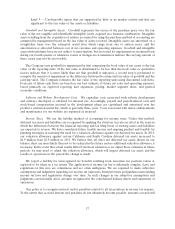
develop budgets, manage expenditures, and determine employee compensation. The presentation of
additional information is not meant to be considered in isolation or as a substitute for or superior to net
income (loss) or net income (loss) per share determined in accordance with GAAP. We believe that it is
important to view free cash flow as a complement to our reported consolidated financial statements.
Management strongly encourages shareholders to review our financial statements and publicly-filed
reports in their entirety and not to rely on any single financial measure.
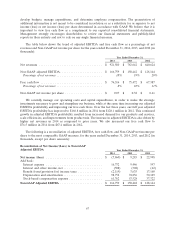
The table below shows the trend of adjusted EBITDA and free cash flow as a percentage of net
revenues and Non-GAAP net income per share for the years ended December 31, 2014, 2013, and 2012 (in
thousands):
Year Ended December 31,
2014 2013 2012
Net revenues .................................... $ 921,580 $ 783,642 $ 640,624
Non-GAAP adjusted EBITDA ........................ $ 166,759 $ 150,442 $ 128,144
Percentage of net revenues .......................... 18% 19% 20%
Free cash flow ................................... $ 76,516 $ 75,472 $ 67,387
Percentage of net revenues .......................... 8% 10% 11%
Non-GAAP net income per share ..................... $ 0.07 $ 0.38 $ 0.61
We carefully manage our operating costs and capital expenditures, in order to make the strategic
investments necessary to grow and strengthen our business, while at the same time increasing our adjusted
EBITDA profitability and improving our free cash flows. Over the last three years, our full year adjusted
EBITDA profitability has improved to $166.8 million in 2014 from $128.1 million in 2012. This continued
growth in adjusted EBITDA profitability resulted from increased demand for our products and services,
scale efficiencies, and improvements from product mix. The increase in adjusted EBITDA is also driven by
higher net revenues in 2014 as compared to prior years. We also increased our free cash flow to
$76.5 million in 2014 from $67.4 million in 2012.
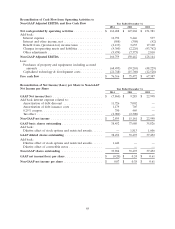
The following is a reconciliation of adjusted EBITDA, free cash flow, and Non-GAAP net income per
share to the most comparable GAAP measure, for the years ended December 31, 2014, 2013, and 2012 (in
thousands, except per share amounts):
Reconciliation of Net Income/(Loss) to Non-GAAP
Adjusted EBITDA Year Ended December 31,
2014 2013 2012
Net income /(loss) ................................ $ (7,860) $ 9,285 $ 22,998
Add back:
Interest expense ................................ 16,732 9,446 597
Interest and other income, net ...................... (508) (308) (42)
Benefit from/(provision for) income taxes .............. (2,119) 3,635 17,160
Depreciation and amortization ...................... 98,752 74,856 50,109
Stock-based compensation expense ................... 61,762 53,528 37,322
Non-GAAP Adjusted EBITDA ........................ $ 166,759 $ 150,442 $ 128,144
67