Shutterfly 2014 Annual Report Download - page 55
Download and view the complete annual report
Please find page 55 of the 2014 Shutterfly annual report below. You can navigate through the pages in the report by either clicking on the pages listed below, or by using the keyword search tool below to find specific information within the annual report.-
 1
1 -
2
-
3
-
4
-
5
-
6
-
7
-
8
-
9
-
10
-
11
-
12
-
13
-
14
-
15
-
16
-
17
-
18
-
19
-
20
-
21
-
22
-
23
-
24
-
25
-
26
-
27
-
28
-
29
-
30
-
31
-
32
-
33
-
34
-
35
-
36
-
37
-
38
-
39
-
40
-
41
-
42
-
43
-
44
-
 45
45 -
 46
46 -
 47
47 -
 48
48 -
 49
49 -
 50
50 -
 51
51 -
 52
52 -
 53
53 -
 54
54 -
 55
55 -
 56
56 -
 57
57 -
 58
58 -
 59
59 -
 60
60 -
 61
61 -
 62
62 -
 63
63 -
 64
64 -
 65
65 -
66
-
67
-
68
-
69
-
70
-
71
-
72
-
73
-
74
-
75
-
76
-
77
-
78
-
79
-
80
-
81
-
82
-
83
-
84
-
85
-
86
-
87
-
88
-
89
-
90
-
91
-
92
-
93
-
94
-
95
-
96
-
97
-
98
-
99
-
100
-
101
-
102
-
103
-
104
-
105
-
106
-
107
-
108
-
109
-
110
-
111
-
112
-
113
-
114
-
115
-
116
-
117
-
118
-
119
-
120
-
121
-
122
-
123
-
124
-
125
-
126
-
127
-
128
-
129
-
130
 |
 |
customer list acquisitions. Total customers have increased on an annual basis for each year since
inception and we expect this trend to continue.
Total Number of Orders. We closely monitor total number of orders as a leading indicator of net
revenue trends. We recognize net revenues associated with an order when the products have been
shipped and all other revenue recognition criteria have been met. Orders are typically processed and
shipped in approximately three business days after a customer places an order. Total number of orders
has increased on an annual basis for each year since 2000, and we anticipate this trend to continue in
the future.
Average Order Value. Average order value (‘‘AOV’’) is Consumer net revenues for a given period
divided by the total number of customer orders recorded during that same period. Average order value
is impacted by product sales mix and pricing and promotional strategies, including our promotions and
competitor promotional activity. As a result, we expect that our average order values may fluctuate on
an annual basis.
We believe the analysis of these metrics and others described below under ‘‘Non-GAAP Financial
Measures’’ provides us with important information on our overall net revenue trends and operating results.
Fluctuations in these metrics are not unusual and no single factor is determinative of our net revenues and
operating results.
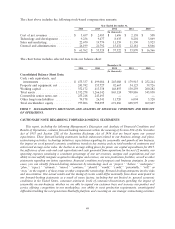
Cost of Net Revenues. Cost of net revenues consists primarily of direct materials (the majority of
which consists of paper, ink, and photo book covers), payroll and related expenses for direct labor,
shipping charges, packaging supplies, distribution and fulfillment activities, rent for production facilities,
depreciation of the facilities where we are the deemed owner (for accounting purposes only) of the
building, depreciation of production equipment, and third-party costs for photo-based merchandise. Cost
of net revenues also includes payroll and related expenses for personnel engaged in customer service, any
third-party software or patents licensed, as well as the amortization of acquired developed technology,
capitalized website and software development costs, and patent royalties. Cost of net revenues also
includes certain costs associated with facility closures and restructuring.
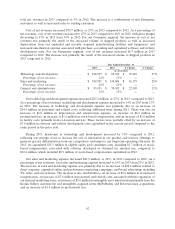
Operating Expenses. Operating expenses consist of technology and development, sales and marketing,
and general and administrative expenses. We anticipate that each of the following categories of operating
expenses will increase in absolute dollar amounts, but remain relatively consistent as a percentage of net
revenues.
Technology and development expense consists primarily of personnel and related costs for employees
and contractors engaged in the development and ongoing maintenance of our websites, infrastructure and
software. These expenses include depreciation of the computer and network hardware used to run our
websites and store the customer data, including data storage for our new ThisLife brand service, as well as
amortization of purchased software. Technology and development expense also includes co-location, power
and bandwidth costs.
Sales and marketing expense consists of costs incurred for marketing programs, and personnel and
related expenses for our customer acquisition, product marketing, business development, and public
relations activities. Our marketing efforts consist of various online and offline media programs, such as
e-mail and direct mail promotions, the purchase of keyword search terms and various strategic alliances.
We depend on these efforts to attract customers to our service.
54