Samsung 2009 Annual Report Download - page 46
Download and view the complete annual report
Please find page 46 of the 2009 Samsung annual report below. You can navigate through the pages in the report by either clicking on the pages listed below, or by using the keyword search tool below to find specific information within the annual report.
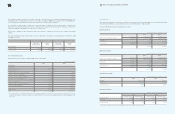
88 89 NOTES TO THE CONSOLIDATED FINANCIAL STATEMENTS
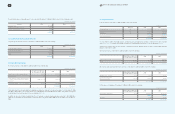
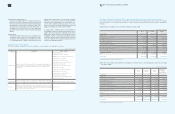
Monetary assets and liabilities of overseas subsidiaries after eliminating intercompany transactions are translated at the foreign exchange
rate in effect as of the balance sheet date.
Foreign currency translation gains and losses for the year ended December 31, 2009, amounted to
₩
1,347,894 million and
₩
1,059,493
million, respectively.
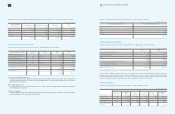
34. Segment Information
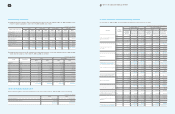
A summary of consolidated financial data by industry as of December 31, 2009 and 2008, and for the years then ended, are follows:
(In millions of Korean won)
Consolidated Balance Sheets by Industry
Non-financial Business Financial Business
2009 2008 2009 2008
Assets
Current assets
₩
55,107,422
₩
40,405,529
₩
6,959,876
₩
8,562,959
Investments 8,835,350 7,255,750 4,606,027 5,570,976
Property, plant and equipment 39,745,848 42,448,832 71,072 48,364
Intangible assets 859,769 741,346 31,254 45,943
Other non-current assets 3,625,210 1,465,850 120,555 205,393
Total assets
₩
108,173,599
₩
92,317,307
₩
11,788,784
₩
14,433,635
Liabilities
Current liabilities
₩
33,491,812
₩
27,345,976
₩
4,081,632
₩
4,861,094
Non-current liabilities 4,368,768 4,366,119 3,281,596 5,803,507
Total liabilities
₩
37,860,580
₩
31,712,095
₩
7,363,228
₩
10,664,601
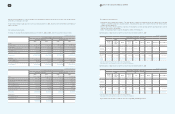
(In millions of Korean won)
Consolidated Statements of Income by Industry
Non-financial Business Financial Business
2009 2008 2009 2008
Sales
₩
136,288,987
₩
118,376,276
₩
2,716,224
₩
2,926,714
Cost of sales 97,922,152 88,526,410 1,020,897 1,236,017
Selling, general and administrative expenses 27,446,572 24,141,296 1,031,763 1,367,467
Operating profit 10,920,263 5,708,570 663,564 323,230
Non-operating income 12,357,716 10,860,880 37,277 68,562
Non-operating expenses 11,187,647 10,255,568 10,407 22,791
Income before income tax 12,090,332 6,313,882 690,434 369,001
Income tax expense 2,248,541 616,473 86,588 71,088
Net income
₩
9,841,791
₩
5,697,409
₩
603,846
₩
297,913
Attributable to:
Controlling interests 9,649,487 5,525,904
Minority interests 192,304 171,505
₩
9,841,791
₩
5,697,409
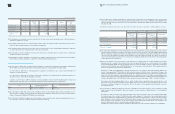
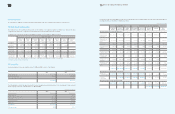
The company has following divisions:
ㆍDigital Media and Communications (‘DMC’) - The DMC division is composed of Digital Media and Telecommunications reporting
segments, and mainly manufactures and sells handsets, networking system and other consumer electronics (TV, monitor, printer,
computer and home appliances).
ㆍDevice Solution (‘DS’) - The DS division is composed of Semiconductor and LCD reporting segments, and manufactures and sells
memory, system LSI, TFT LCD and HDD.
ㆍOthers – Others primarily represent corporate headquarters, institute of technology, etc.
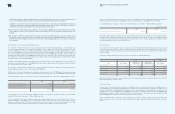
Operating data according to business segment as of and for the year ended December 31, 2009:
1. Net sales include intersegment sales of SEC and foreign subsidiaries.
2. Operating profit of each segment is inclusive of all consolidation eliminations.
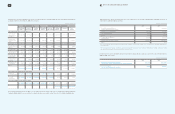
Operating data according to business segment as of and for the year ended December 31, 2008:
1. Net sales include intersegment sales of SEC and foreign subsidiaries.
2. Operating profit of each segment is inclusive of all consolidation eliminations.
The presentation and classification of 2008 was revised for comparability with 2009 presentation.
(In millions of Korean won)
2009 Summary of Business by Segment
DMC DS
Digital
Media
Tele-
communi
cation
Others Semicon
ductor LCD Others Others Elimination Consolidated
Gross sale
₩
123,058,865
₩
83,143,634
₩
2,166,082
₩
55,199,342
₩
48,966,567
₩
77,355
₩
10,542,035
₩ (184,160,209)
₩ 138,993,671
Interseg
mentsales (74,166,362) (41,052,313) (1,536,755) (28,348,893) (26,686,990) (42,464) (2,172,247) 174,006,024 -
Net sales148,892,503 42,091,321 629,327 26,850,449 22,279,577 34,891 8,369,788 (10,154,185) 138,993,671
Operating
profit22,846,955 4,129,480 7,202 2,415,691 1,384,207 (1,965) 796,081 - 11,577,651
Total
assets
₩
42,379,343
₩
31,672,577
₩
3,273,195
₩ 43,825,935 ₩ 22,017,969 ₩ 125,361
₩
26,000,929
₩ (51,013,821)
₩
118,281,488
(In millions of Korean won)
2008 Summary of Business by Segment
DMC DS
Digital
Media
Tele-
communi
cation
Others Semicon
ductor LCD Others Others Elimination Consolidated
Gross sale
₩
90,443,226
₩
64,676,221
₩
2,239,473
₩
41,760,580
₩
42,707,995
₩ 201,285
₩
24,024,623
₩ (144,759,084)
₩ 121,294,319
Interseg
mentsales (48,251,458) (30,107,544) (1,591,245) (19,407,221) (21,190,427) (84,476) (15,290,075) 135,922,446 -
Net sales 1 42,191,768 34,568,677 648,228 22,353,359 21,517,568 116,809 8,734,548 (8,836,638) 121,294,319
Operating
profit 2 396,183 2,976,174 (9,477) (1,970) 2,346,047 11,036 313,870 - 6,031,863
Total
assets
₩
32,469,249
₩
24,536,836
₩
7,034,251
₩ 38,054,435 ₩ 22,112,165
₩
51,290
₩
18,950,265
₩ (37,907,841) ₩ 105,300,650


