Samsung 2009 Annual Report Download - page 25
Download and view the complete annual report
Please find page 25 of the 2009 Samsung annual report below. You can navigate through the pages in the report by either clicking on the pages listed below, or by using the keyword search tool below to find specific information within the annual report.-
 1
1 -
2
-
3
-
4
-
5
-
6
-
7
-
8
-
9
-
10
-
11
-
12
-
13
-
14
-
 15
15 -
 16
16 -
 17
17 -
 18
18 -
 19
19 -
 20
20 -
 21
21 -
 22
22 -
 23
23 -
 24
24 -
 25
25 -
 26
26 -
 27
27 -
 28
28 -
 29
29 -
 30
30 -
 31
31 -
 32
32 -
 33
33 -
 34
34 -
 35
35 -
36
-
37
-
38
-
39
-
40
-
41
-
42
-
43
-
44
-
45
-
46
-
47
-
48
-
49
-
50
-
51
 |
 |
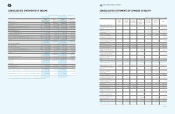
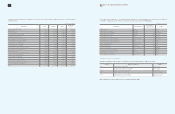
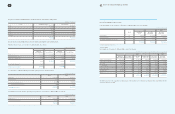
46 47 CONSOLIDATED FINANCIAL STATEMENTS
(In millions of Korean won, in thousands of U.S. dollars)
Capital
Stock
Capital
Surplus
Capital
Adjustments
Accumulated
Other
Comprehensive
Income
Retained
Earnings
Minority
Interests Total
Balance at January 1, 2009
₩
897,514
₩
6,588,861
₩
(8,597,013)
₩
3,808,076
₩
55,419,571
₩
4,806,945
₩
62,923,954
Cash dividends appropriated in
prior year - - - - (735,441) (60,183) (795,624)
Retained earnings after
appropriations - - - - 54,684,130 4,746,762 62,128,330
Interim cash dividends - - - - (73,507) (2,042) (75,549)
Change in ownership interests,
including new stock issues by
consolidated subsidiaries
- 53,737 - - - 163,152 216,889
Cumulative effects of changes in
scope of consolidation - - - - - 721,953 721,953
Net income - - - - 9,649,487 580,434 10,229,921
Disposal of treasury stock - (1,313) 505,344 - - - 504,031
Stock option activities - - (172,874) - - - (172,874)
Market value adjustments for
available-for-sale securities, net - - - 139,874 - 64,991 204,865
Change in share of equity method
investees accumulated other
comprehensive income, net
- - - 108,740 - - 108,740
Translation of foreign currency
financial statements - - - (794,330) - (77,348) (871,678)
Others - 10,825 8,884 10,173 1,094 28,688 59,664
Balance at December 31, 2009
₩
897,514
₩
6,652,110
₩
(8,255,659)
₩
3,272,533
₩
64,261,204
₩
6,226,590
₩
73,054,292
Balance at January 1, 2009 $ 769,078 $ 5,645,982 $ (7,366,764) $ 3,263,133 $ 47,488,921 $ 4,119,062 $ 53,919,412
Cash dividends appropriated in
prior year - - - - (630,198) (51,571) (681,769)
Retained earnings after
appropriations - - - - 46,858,723 4,067,491 53,237,643
Interim cash dividends - - - - (62,988) (1,750) (64,738)
Change in ownership interests,
including new stock issues by
consolidated subsidiaries
- 46,047 - - - 139,805 185,852
Cumulative effects of changes in
scope of consolidation - - - - - 618,640 618,640
Net income - - - - 8,268,626 497,373 8,765,999
Disposal of treasury stock - (1,125) 433,028 - - - 431,903
Stock option activities - (148,135) - - - (148,135)
Market value adjustments for
available-for-sale securities, net - - - 119,858 - 55,691 175,549
Change in share of equity method
investees accumulated other
comprehensive income, net
- - - 93,179 - - 93,179
Translation of foreign currency
financial statements - - - (680,660) - (66,279) (746,939)
Others - 9,276 7,613 8,717 938 24,852 51,126
Balance at December 31, 2009 $ 769,078 $ 5,700,180 $ (7,074,258) $ 2,804,227 $ 55,065,299 $ 5,335,553 $ 62,600,079
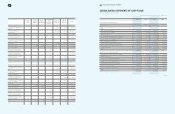
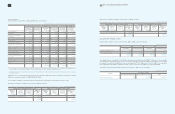
CONSOLIDATED STATEMENTS OF CASH FLOWS
For the Years Ended December 31, 2009 and 2008
(In millions of Korean won and in thousands of U.S. dollars (Note 3))
2008 2008
Cash flows from operating activities
Net income
₩
5,890,214 $ 5,047,313
Adjustments to reconcile net income to net cash provided by operating
activities :
Depreciation and amortization 10,095,191 8,650,549
Provision for severance benefits 543,980 466,135
Bad debt expenses 532,429 456,237
Loss on disposal of property, plant and equipment 62,292 53,378
Gain on disposal of property, plant and equipment (110,962) (95,083)
Loss on foreign currency translation 1,070,358 917,188
Gain on foreign currency translation (447,885) (383,792)
Loss on valuation of equity-method investments 209,357 179,398
Gain on valuation of equity-method investments (748,398) (641,301)
Deferred income taxes (500,435) (428,822)
Others 1,289,732 1,105,169
17,885,873 15,326,369
Changes in operating assets and liabilities
Increase in trade accounts and notes receivable (86,180) (73,847)
Increase in inventories (693,712) (594,440)
Decrease (increase) in financing receivables (1,313,573) (1,125,598)
Increase (decrease) in trade accounts and notes payable (1,514,400) (1,297,686)
Increase (decrease) in accrued expenses (207,881) (178,133)
Increase (decrease) in income taxes payable (751,619) (644,061)
Payment of severance benefits (301,887) (258,686)
Increase in long-term accrued expenses 408,324 349,892
Others (64,870) (55,588)
Net cash provided by operating activities 13,360,075 11,448,222
2009
₩
10,229,921
11,159,446
645,440
337,075
120,676
(66,636)
1,059,493
(1,347,894)
121,702
(943,339)
(13,633)
1,385,560
22,687,811
(6,227,873)
(1,092,243)
915,952
3,474,003
1,051,084
499,800
(520,020)
519,200
(1,651,924)
19,655,790
2009
$ 8,765,999
9,562,507
553,076
288,839
103,407
(57,100)
907,877
(1,155,008)
104,286
(808,345)
(11,682)
1,187,284
19,441,140
(5,336,652)
(935,941)
784,877
2,976,866
900,672
428,278
(445,604)
444,901
(1,415,529)
16,843,008
continued