Samsung 2009 Annual Report Download - page 2
Download and view the complete annual report
Please find page 2 of the 2009 Samsung annual report below. You can navigate through the pages in the report by either clicking on the pages listed below, or by using the keyword search tool below to find specific information within the annual report.-
 1
1 -
 2
2 -
 3
3 -
 4
4 -
 5
5 -
 6
6 -
 7
7 -
 8
8 -
 9
9 -
 10
10 -
 11
11 -
 12
12 -
 13
13 -
14
-
15
-
16
-
17
-
18
-
19
-
20
-
21
-
22
-
23
-
24
-
25
-
26
-
27
-
28
-
29
-
30
-
31
-
32
-
33
-
34
-
35
-
36
-
37
-
38
-
39
-
40
-
41
-
42
-
43
-
44
-
45
-
46
-
47
-
48
-
49
-
50
-
51
 |
 |

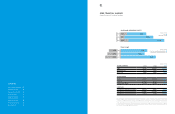
2009 FINANCIAL SUMMARY
Samsung Electronics and Consolidated Subsidiaries
This annual report includes forward-looking statements which relate to future events and can be generally identified by
phrases containing words such as “believes,” “expects,” “anticipates,” “foresees,” “forecasts,” “estimates,” or other words
or phrases of similar meaning. These forward-looking statements are not guarantees of future performance and may involve
known and unknown risks, uncertainties and other factors that may affect our actual results, performance, achievements
or financial position, making them materially different from the actual future results, performance, achievements or financial
position expressed or implied by these forward-looking statements. Unless otherwise specified, all data presented in this
report is from our consolidated financial statements.
INCOME STATEMENTS 2007 2008 2009
Sales 98,508 121,294 138,994
Operating Profit 8,973 6,032 11,578
Net Income 7,421 5,526 9,649
BALANCE SHEETS
Assets 93,375 105,301 118,281
Liabilities 37,403 42,377 45,227
Shareholders’ Equity 55,972 62,924 73,054
CASH FLOWS
Cash Flows from Operating Activities 14,791 13,360 19,656
Cash Flows from Investing Activities (12,002) (13,128) (14,424)
Cash Flows from Financing Activities (1,600) 1,934 (3,948)
(in billions of KRW)
CASH FLOWS
2008
2009
2007
-12.0
-13.1
-14.4
14.8
13.4
19.7
SALES AND OPERATING PROFIT
2007
2008
2009
Sales
Operating Profit
(in trillions of KRW)
Cash Flows from Operating Activities
Cash Flows from Investing Activities
(in trillions of KRW)
9.0
6.0
11.6
98.5
121.3
139.0
01
Contents
2009 Financial Summary 01
Relentless Passion 02
Message from the CEO 10
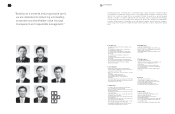
About the Board 14
Inspire the World, 16
Create the Future
Business Overview 28
Financial Statements 39
Global Network 94