Samsung 2009 Annual Report Download - page 43
Download and view the complete annual report
Please find page 43 of the 2009 Samsung annual report below. You can navigate through the pages in the report by either clicking on the pages listed below, or by using the keyword search tool below to find specific information within the annual report.-
 1
1 -
2
-
3
-
4
-
5
-
6
-
7
-
8
-
9
-
10
-
11
-
12
-
13
-
14
-
15
-
16
-
17
-
18
-
19
-
20
-
21
-
22
-
23
-
24
-
25
-
26
-
27
-
28
-
29
-
30
-
31
-
32
-
 33
33 -
 34
34 -
 35
35 -
 36
36 -
 37
37 -
 38
38 -
 39
39 -
 40
40 -
 41
41 -
 42
42 -
 43
43 -
 44
44 -
 45
45 -
 46
46 -
 47
47 -
 48
48 -
 49
49 -
 50
50 -
 51
51
 |
 |
82 83 NOTES TO THE CONSOLIDATED FINANCIAL STATEMENTS
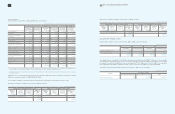
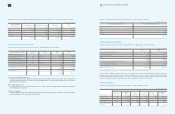
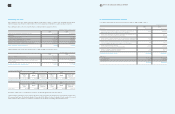
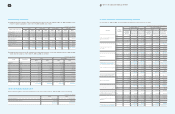
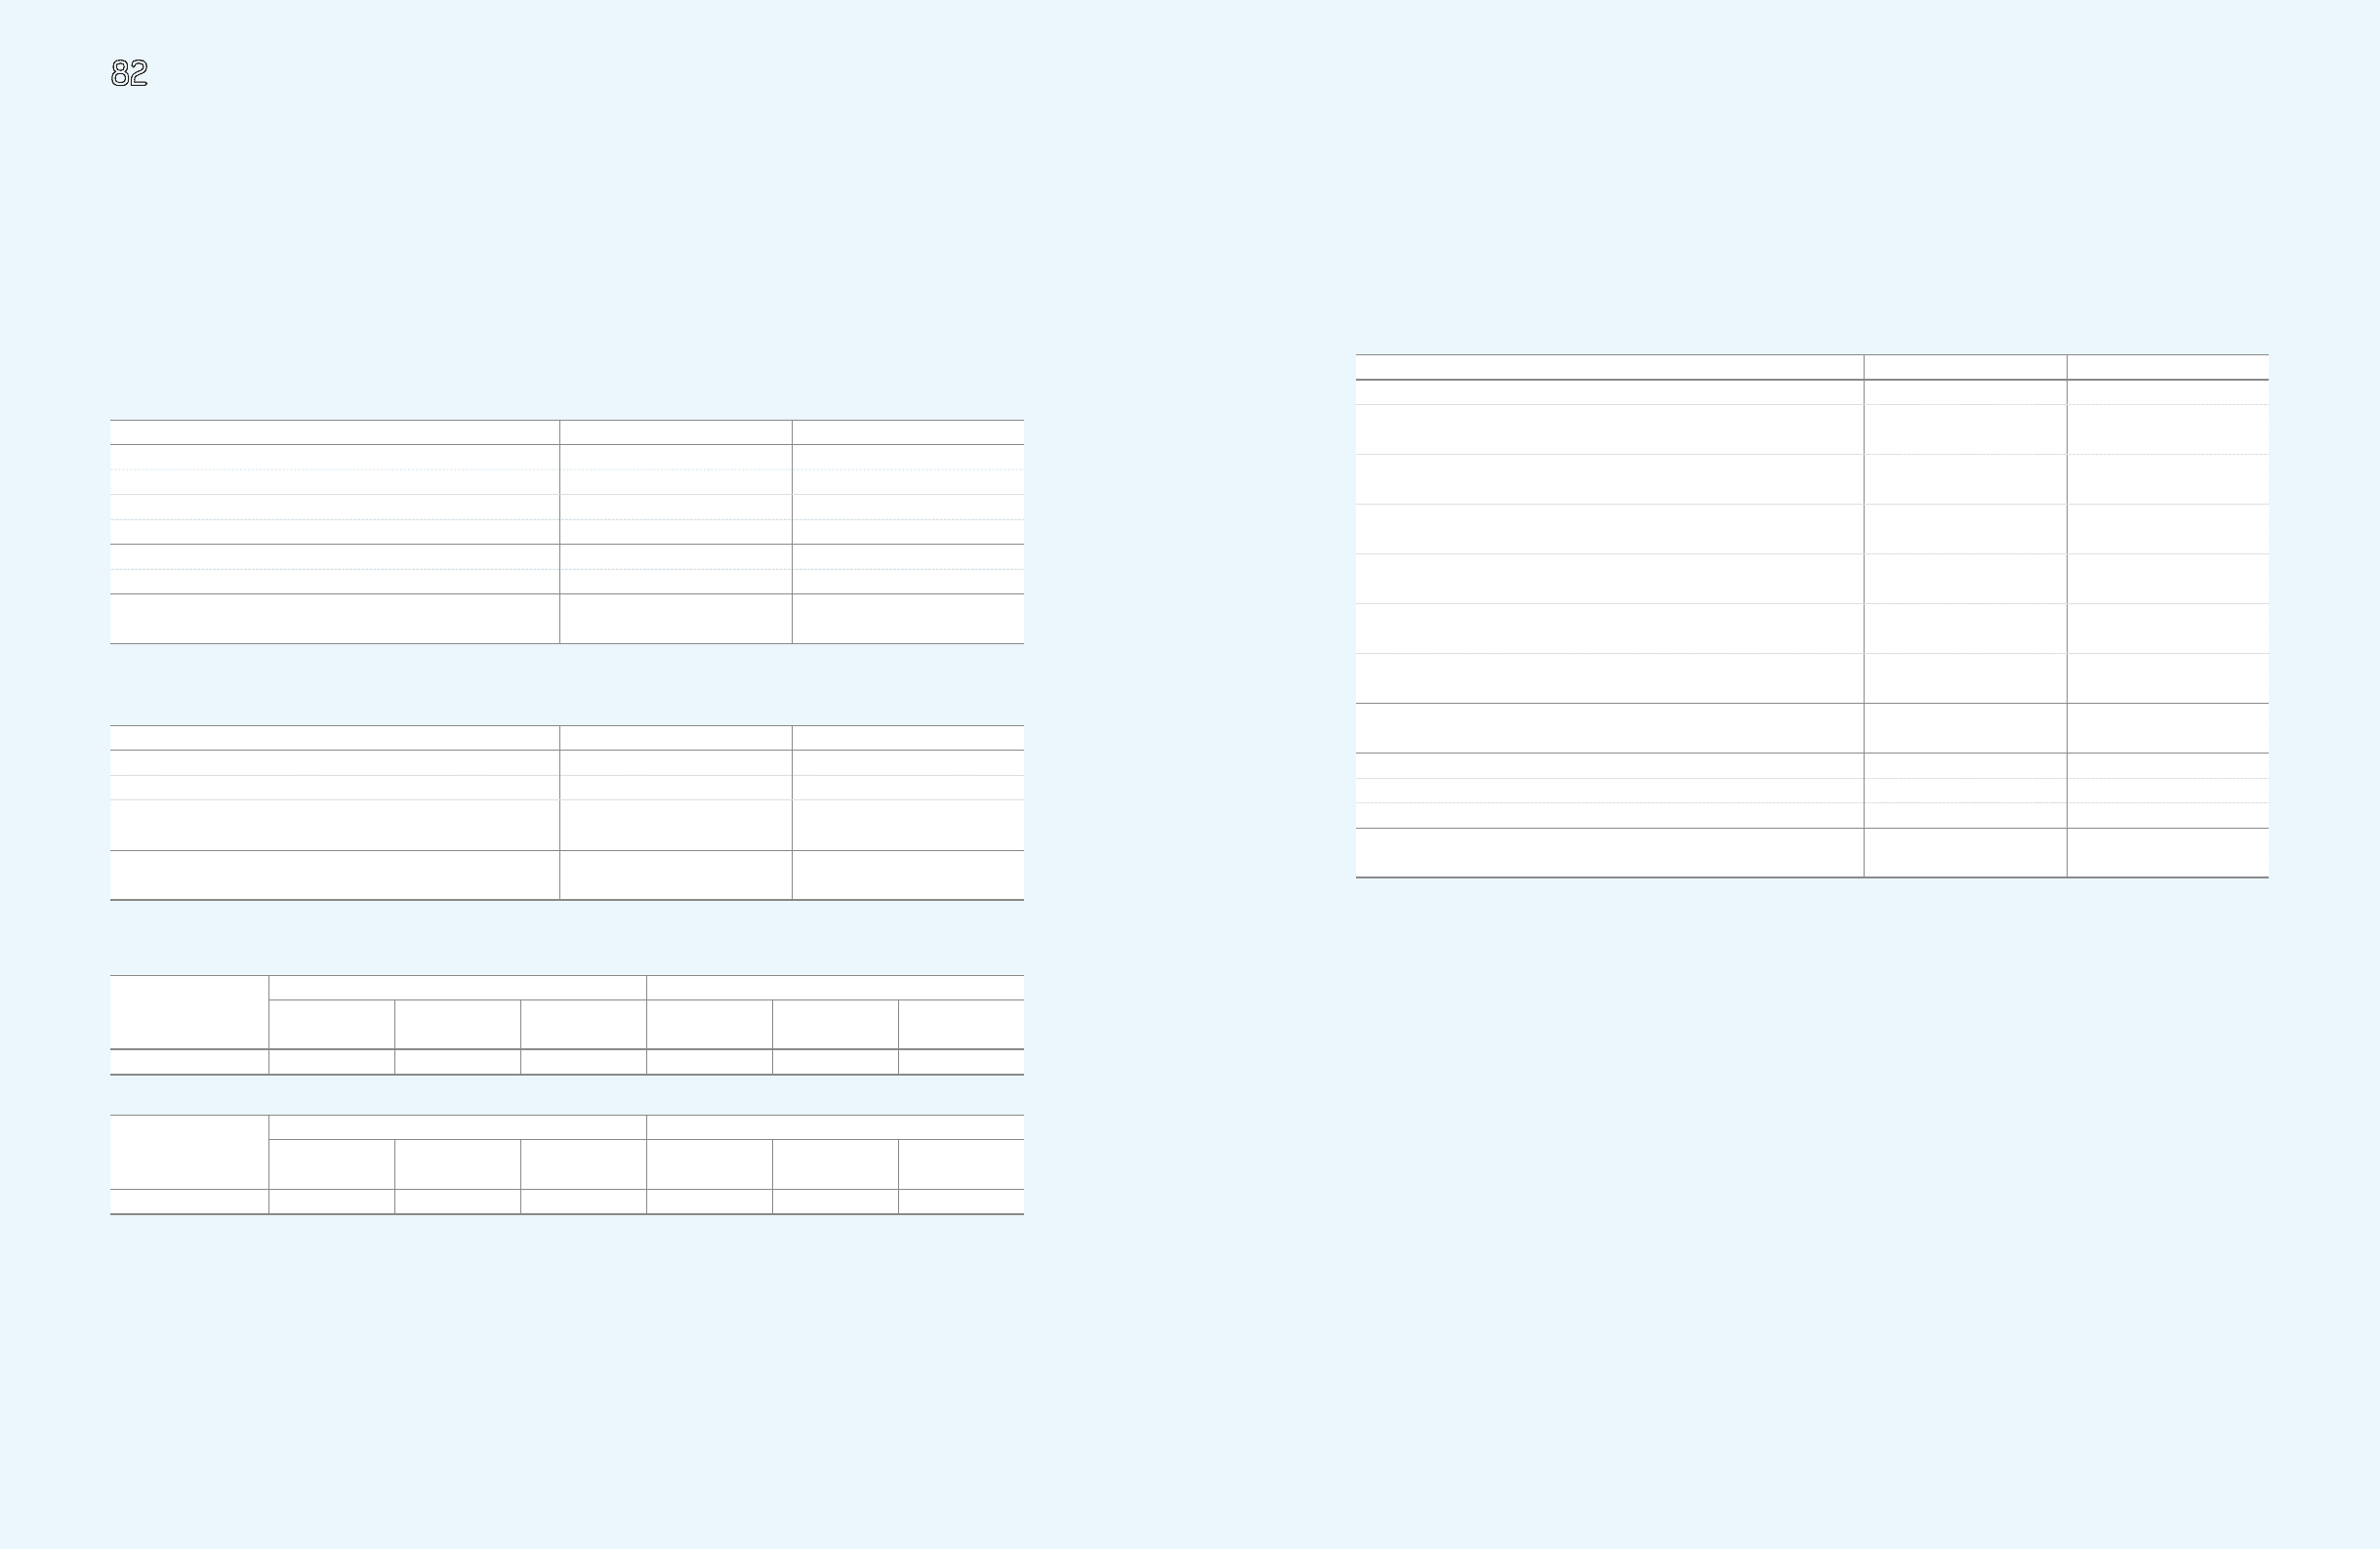
28. Earnings Per Share
Basic earnings per share were computed using the weighted average number of shares of common stock outstanding during the period.
Diluted earnings per share include the additional dilutive effect of the Company’s potentially dilutive securities including stock options.
Basic earnings per share for the years ended December 31, 2009 and 2008, is calculated as follows:
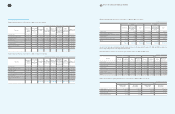
Diluted earnings per share for the years ended December 31, 2009 and 2008, is calculated as follows:
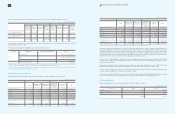
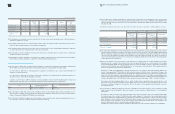
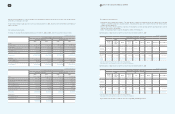
1. Common shares Outstanding
2. Common shares equivalent
The number of dilutive shares of outstanding stock options is calculated by applying the treasury stock method.
Under the treasury stock method, the proceeds from the exercise of the stock options are assumed to be used to purchase common stock
at the average market price. The incremental number of shares which is the difference between the number of shares assumed to be issued
and the number of shares assumed to be purchased, is included in the denominator in calculating diluted earnings per share.
(In millions, except per number of shares)
2009 2008
Net income as reported on the statements of income
₩
9,649,487
₩
5,525,904
Adjustments:
Dividends for preferred stock (159,823) (110,188)
Undeclared participating preferred stock dividend (1,134,392) (637,556)
Net income available for common stock 8,355,272 4,778,160
Weighted-average number of common shares Outstanding 1 127,563,732 126,795,572
Basic earnings per share (in Korean won)
₩
65,499
₩
37,684
(In millions, except per share amounts)
2009 2008
Net income available for common stock
₩
8,355,272
₩
4,778,160
Net income available for common stock and common equivalent shares 8,355,272 4,778,160
Weighted-average number of shares of common stock and common
shares equivalent 2 128,161,094 127,963,702
Diluted earnings per share (in Korean won)
₩
65,194
₩
37,340
2009 2008
Number of
Shares Weight Common Stock
Equivalent
Number of
Shares Weight Common Stock
Equivalent
Common stock shares 127,563,732 365/365 127,563,732 126,795,572 366/366 126,795,572
2009 2008
Number of
Shares Weight Common Stock
Equivalent
Number of
Shares Weight Common Stock
Equivalent
Stock options 597,362 365/365 597,362 1,168,130 366/366 1,168,130
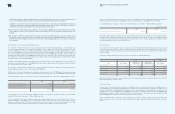
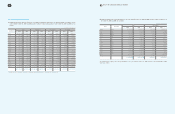
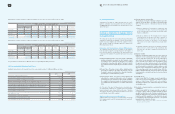
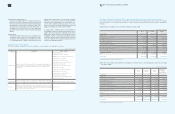
29. Consolidated Comprehensive Income
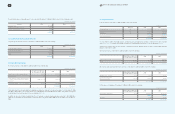
Consolidated comprehensive income for the years ended December 31, 2009 and 2008, consist of:
(In millions of Korean won)
2009 2008
Net income
₩
10,229,921
₩
5,890,214
Changes in accumulated gain on valuation of available-for-sale securities, net of
related income taxes of
₩
51,242 million (2008:
₩
371,759 million) 204,192 (660,687)
Changes in accumulated loss on valuation of available-for-sale securities, net of
related income taxes of
₩
246 million (2008:
₩
30 million) 673 (28,799)
Changes in share of equity-method investees’ accumulated other comprehensive
income, net of related income taxes of
₩
25,670 million (2008:
₩
12,349 million) 104,588 5,737
Changes in share of equity-method investees’ accumulated other comprehensive
loss, net of related income taxes of
₩
573 million (2008:
₩
729 million) 4,152 (5,424)
Foreign currency translation adjustment,
net of tax of
₩
122,105 million (2008:
₩
324,059 million) (871,678) 2,735,128
Gain (loss) on valuation of derivative instruments, net of
tax of
₩
8,017 million (2008:
₩
13,802 million) 28,823 (46,313)
Consolidated comprehensive income
₩
9,700,671
₩
7,889,856
Attributable to :
Controlling interests
₩
9,113,943
₩
7,458,595
Minority interests 586,728 431,261
₩
9,700,671
₩
7,889,856